Exhibit 99.1
| HANMI FINANCIAL CORPORATION Nasdaq: HAFC Hoefer & Arnett Asian Banking Conference November 9, 2004 |
| Safe Harbor Statement Certain statements contained in this presentation, including, without limitation, statements containing the words "believes," "plans," "expects," "anticipates," and words of similar import, constitute "forward-looking statements" within the meaning of the Private Securities Litigation Reform Act of 1995. Such forward-looking statements involve known and unknown risks, uncertainties and other factors that may cause the actual results, performance or achievements of the Company to be materially different from any future results, performance or achievements expressed or implied by such forward- looking statements. Such factors include, among others, the following: general economic and business conditions in those areas in which the Company operates; demographic changes; competition; fluctuations in market interest rates; changes in credit quality; and other risks detailed in the most recent quarterly and annual reports filed with the Securities Exchange Commission, including the Company's Form 10-K for the year ended December 31, 2003 and Form 10-Q for the quarter ended September 30, 2004. Given these uncertainties, undue reliance should not be placed on such forward-looking statements. The Company disclaims any obligation to update any such factors or to publicly announce the results of any revisions to any of the forward- looking statements contained herein to reflect future events or developments. |
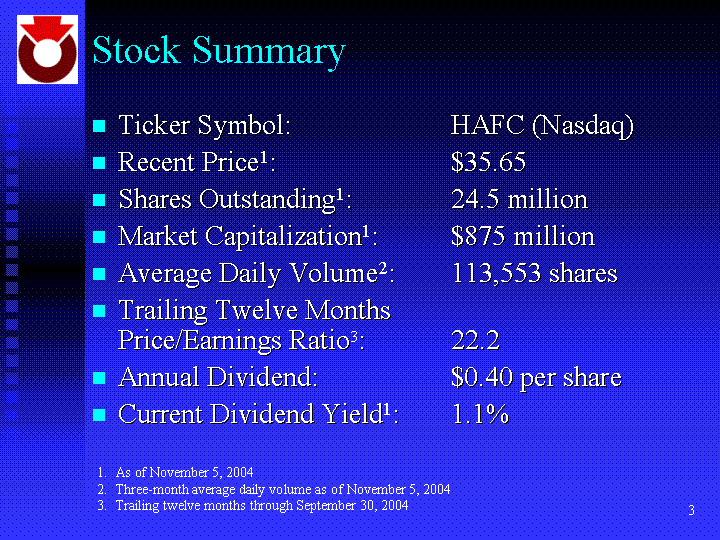
| Stock Summary Ticker Symbol: HAFC (Nasdaq) Recent Price1: $35.65 Shares Outstanding1: 24.5 million Market Capitalization1: $875 million Average Daily Volume2: 113,553 shares Trailing Twelve Months Price/Earnings Ratio3: 22.2 Annual Dividend: $0.40 per share Current Dividend Yield1: 1.1% 1. As of November 5, 2004 2. Three-month average daily volume as of November 5, 2004 3. Trailing twelve months through September 30, 2004 |
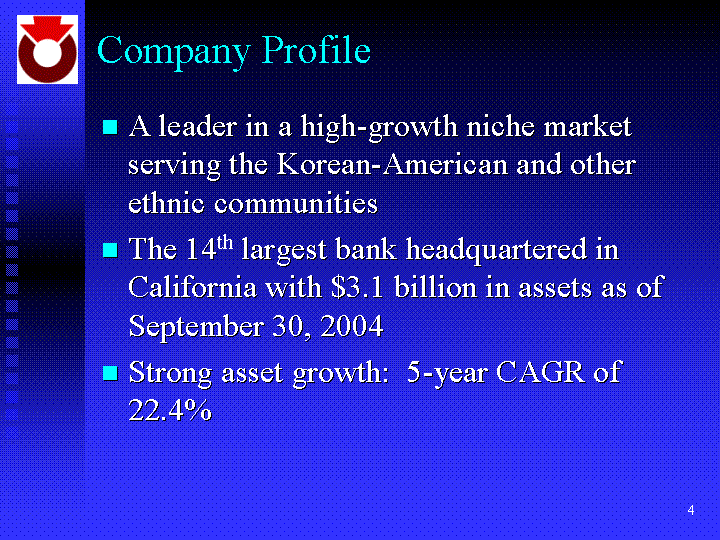
| Company Profile A leader in a high-growth niche market serving the Korean-American and other ethnic communities The 14th largest bank headquartered in California with $3.1 billion in assets as of September 30, 2004 Strong asset growth: 5-year CAGR of 22.4% |
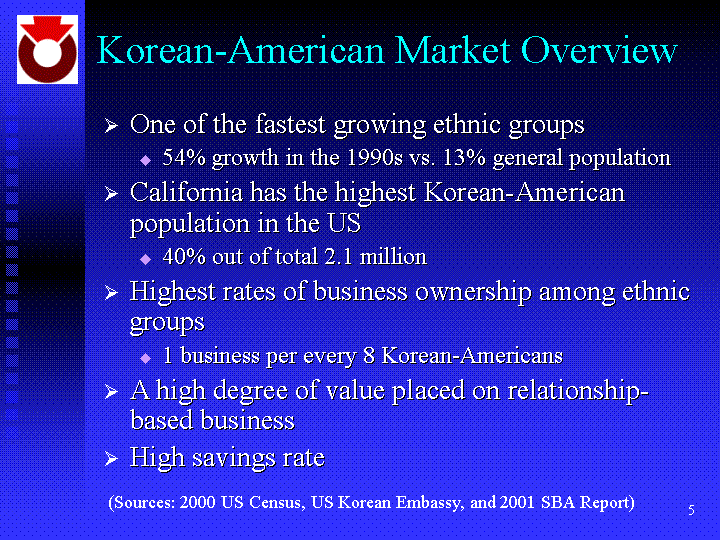
| Korean-American Market Overview One of the fastest growing ethnic groups 54% growth in the 1990s vs. 13% general population California has the highest Korean-American population in the US 40% out of total 2.1 million Highest rates of business ownership among ethnic groups 1 business per every 8 Korean-Americans A high degree of value placed on relationship- based business High savings rate (Sources: 2000 US Census, US Korean Embassy, and 2001 SBA Report) |
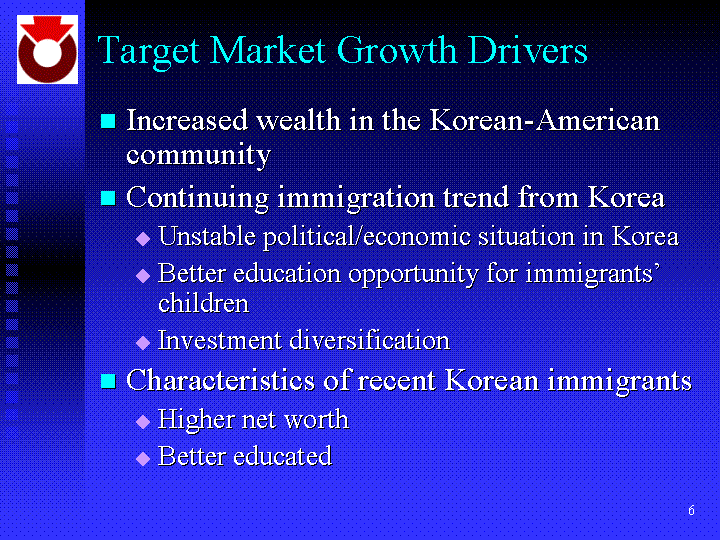
| Target Market Growth Drivers Increased wealth in the Korean-American community Continuing immigration trend from Korea Unstable political/economic situation in Korea Better education opportunity for immigrants' children Investment diversification Characteristics of recent Korean immigrants Higher net worth Better educated |
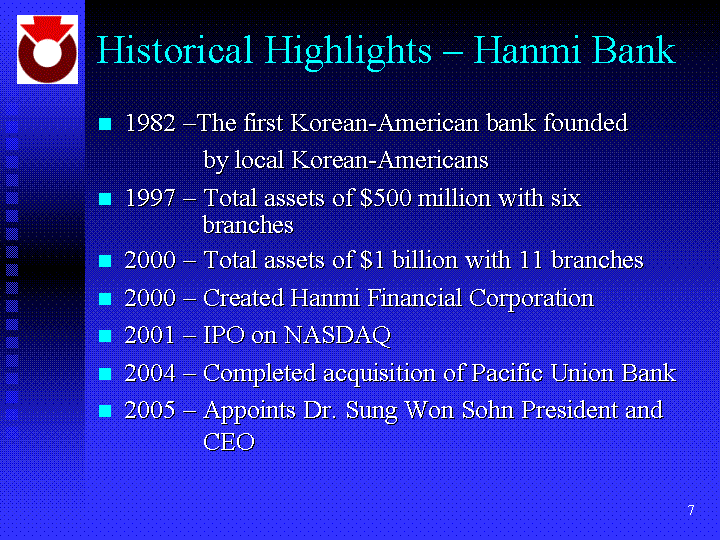
| Historical Highlights - Hanmi Bank 1982 -The first Korean-American bank founded by local Korean-Americans 1997 - Total assets of $500 million with six branches 2000 - Total assets of $1 billion with 11 branches 2000 - Created Hanmi Financial Corporation 2001 - IPO on NASDAQ 2004 - Completed acquisition of Pacific Union Bank 2005 - Appoints Dr. Sung Won Sohn President and CEO |
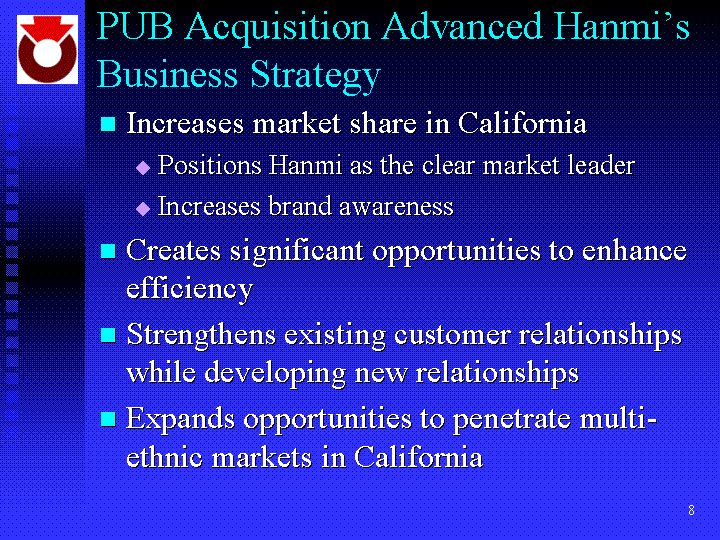
| PUB Acquisition Advanced Hanmi's Business Strategy Increases market share in California Positions Hanmi as the clear market leader Increases brand awareness Creates significant opportunities to enhance efficiency Strengthens existing customer relationships while developing new relationships Expands opportunities to penetrate multi- ethnic markets in California |
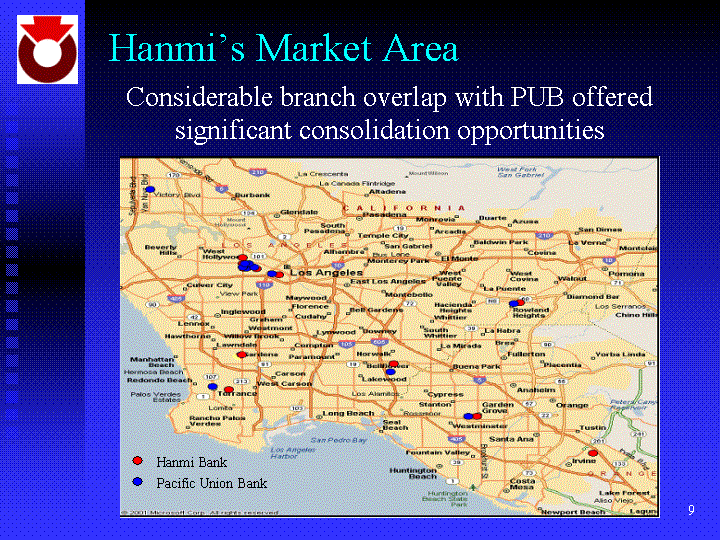
| Hanmi's Market Area Considerable branch overlap with PUB offered significant consolidation opportunities Hanmi Bank Pacific Union Bank |
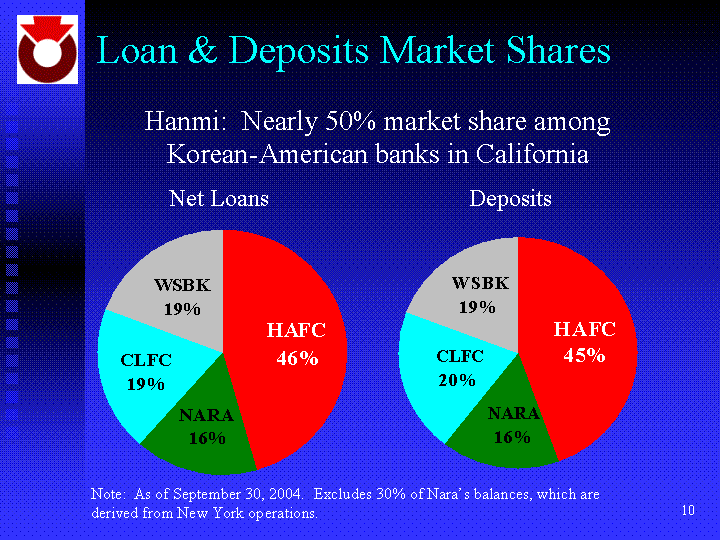
| Loan & Deposits Market Shares Hanmi: Nearly 50% market share among Korean-American banks in California HAFC 0.45 NARA 0.16 CLFC 0.19 WSBK 0.19 HAFC 0.44 NARA 0.16 CLFC 0.2 WSBK 0.19 Deposits Net Loans Note: As of September 30, 2004. Excludes 30% of Nara's balances, which are derived from New York operations. |
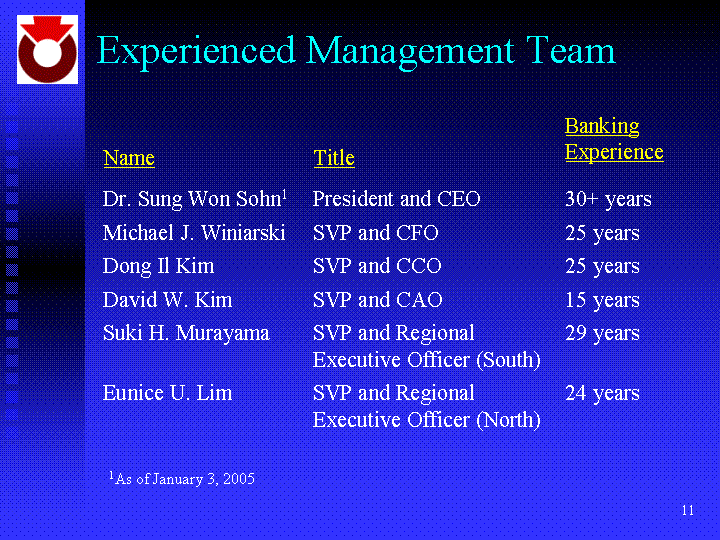
| Experienced Management Team Name Title Banking Experience Dr. Sung Won Sohn1 President and CEO 30+ years Michael J. Winiarski SVP and CFO 25 years Dong Il Kim SVP and CCO 25 years David W. Kim SVP and CAO 15 years Suki H. Murayama SVP and Regional Executive Officer (South) 29 years Eunice U. Lim SVP and Regional Executive Officer (North) 24 years 1As of January 3, 2005 |
| Hanmi's Business Focus Commercial and retail banking Primary focus: Korean-American community Cultivate banking relationships with other multi-ethnic communities Full suite of financial products and services Traditional depository, loan, and trade finance products Investment and insurance products Personalized customer service Customers have responded to our relationship-based business approach |
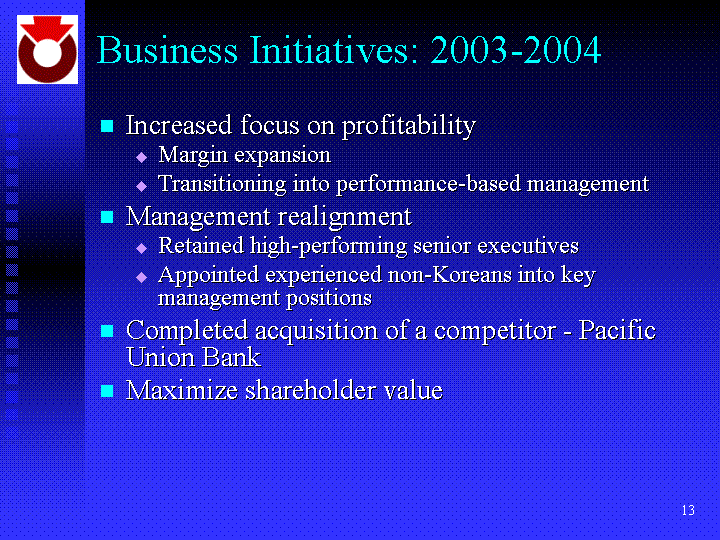
| Business Initiatives: 2003-2004 Increased focus on profitability Margin expansion Transitioning into performance-based management Management realignment Retained high-performing senior executives Appointed experienced non-Koreans into key management positions Completed acquisition of a competitor - Pacific Union Bank Maximize shareholder value |
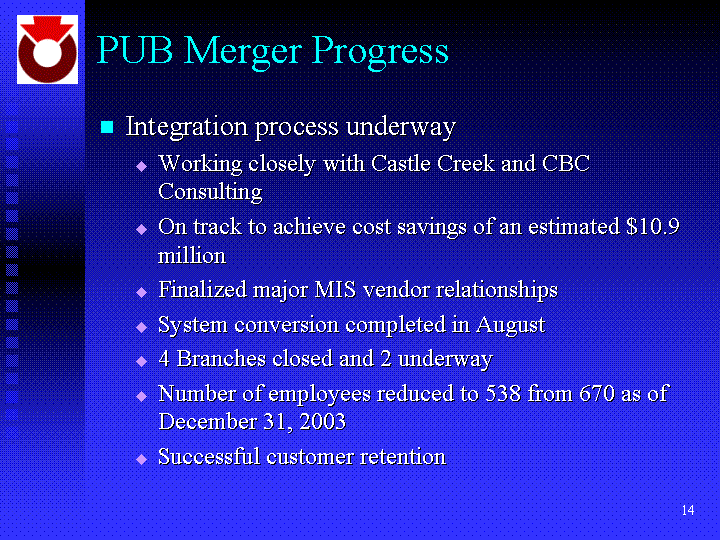
| PUB Merger Progress Integration process underway Working closely with Castle Creek and CBC Consulting On track to achieve cost savings of an estimated $10.9 million Finalized major MIS vendor relationships System conversion completed in August 4 Branches closed and 2 underway Number of employees reduced to 538 from 670 as of December 31, 2003 Successful customer retention |
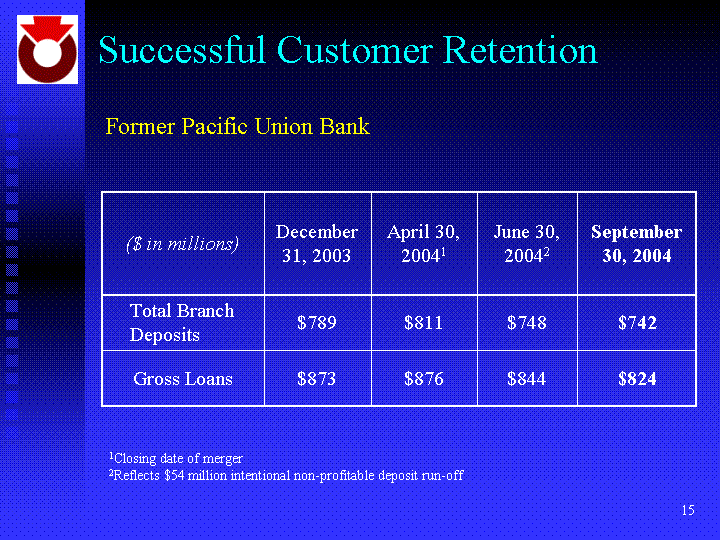
| Successful Customer Retention ($ in millions) December 31, 2003 April 30, 20041 June 30, 20042 September 30, 2004 Total Branch Deposits $789 $811 $748 $742 Gross Loans $873 $876 $844 $824 Former Pacific Union Bank 1Closing date of merger 2Reflects $54 million intentional non-profitable deposit run-off |

| ($ in millions) 2000 2001 2002 2003 2004 3Q Loans 620 820 1000 1270 2250 Deposits 940 1040 1290 1450 2400 Assets 1030 1160 1460 1790 3100 Financial Performance Consistent Balance Sheet Growth |
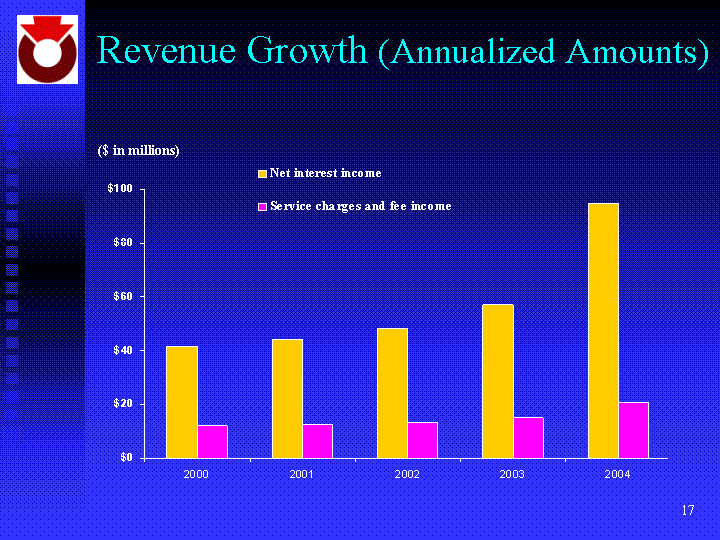
| Revenue Growth (Annualized Amounts) 2000 2001 2002 2003 2004 Net interest income 41.54 43.95 48.26 56.97 94.85 Service charges and fee income 12.11 12.53 13.19 15.05 20.55 ($ in millions) |
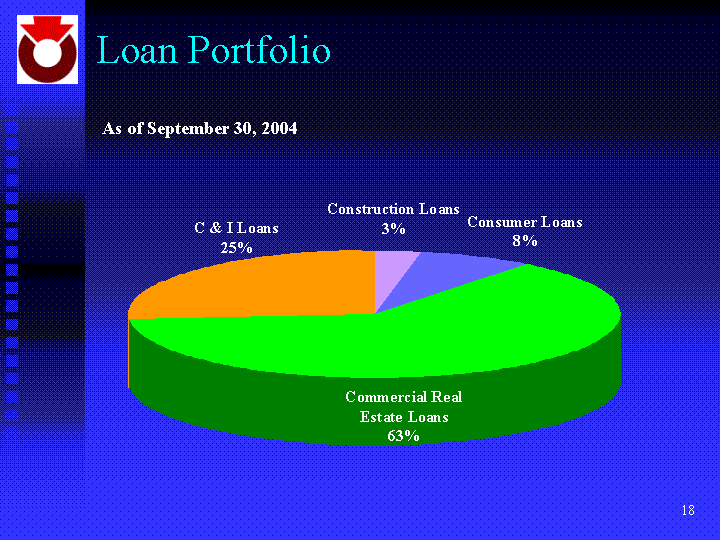
| Loan Portfolio As of September 30, 2004 Construction Loans 67952 Consumer Loans 172588 Commercial Real Estate Loans 1441229 C & I Loans 578585 Other Loans 18707 |
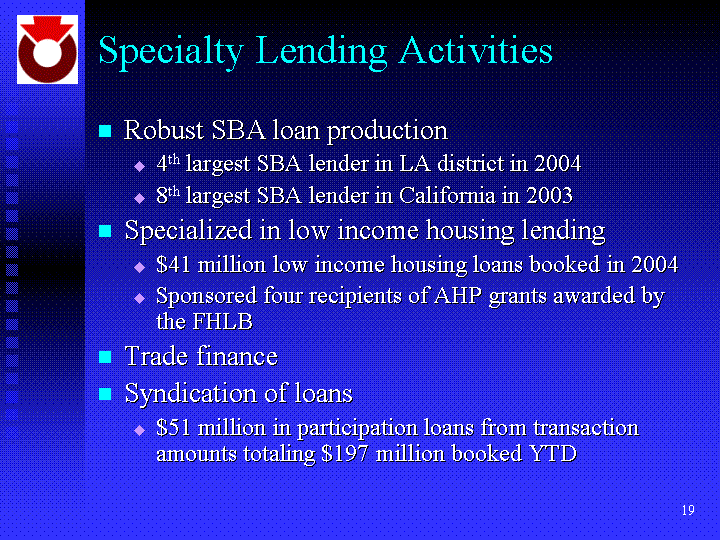
| Specialty Lending Activities Robust SBA loan production 4th largest SBA lender in LA district in 2004 8th largest SBA lender in California in 2003 Specialized in low income housing lending $41 million low income housing loans booked in 2004 Sponsored four recipients of AHP grants awarded by the FHLB Trade finance Syndication of loans $51 million in participation loans from transaction amounts totaling $197 million booked YTD |
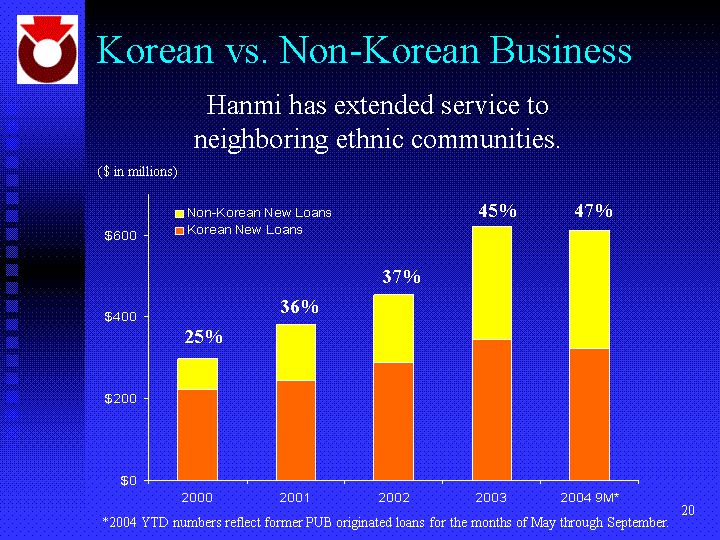
| Korean vs. Non-Korean Business 2000 2001 2002 2003 2004 9M* Korean New Loans 221.1 245.7 287.4 344.5 322.96 Non-Korean New Loans 75.4 136.3 165.5 278.4 288.9 ($ in millions) Hanmi has extended service to neighboring ethnic communities. 45% *2004 YTD numbers reflect former PUB originated loans for the months of May through September. 25% 47% 36% 37% |
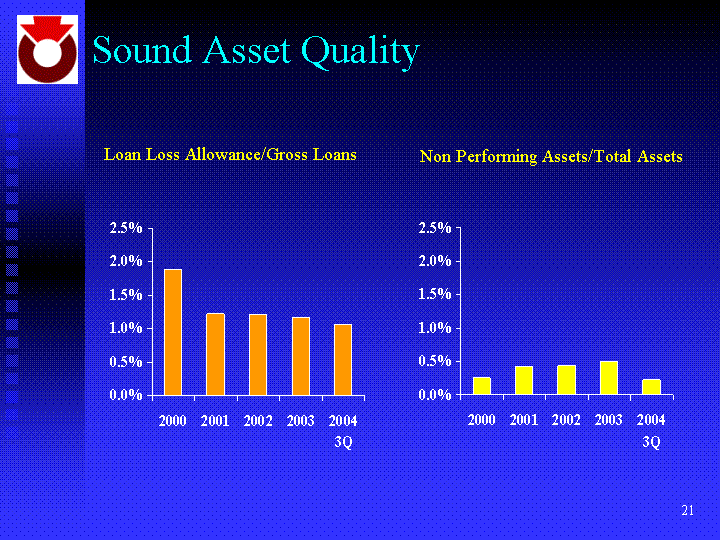
| Sound Asset Quality Loan Loss Allowance/Gross Loans 2000 2001 2002 2003 2004 3Q Hanmi 0.0189 0.0121 0.012 0.0116 0.0105 Non Performing Assets/Total Assets 2000 2001 2002 2003 2004 3Q Hanmi 0.0025 0.0043 0.0044 0.0049 0.0022 |
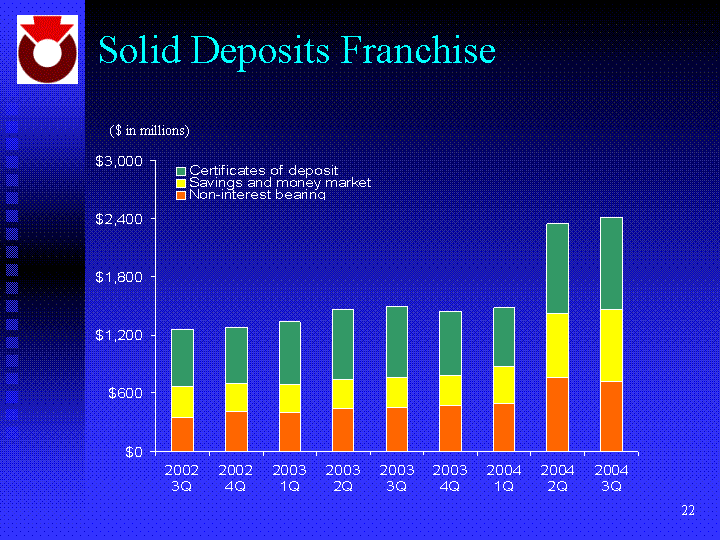
| Solid Deposits Franchise 2002 3Q 2002 4Q 2003 1Q 2003 2Q 2003 3Q 2003 4Q 2004 1Q 2004 2Q 2004 3Q Non-interest bearing 350 410 400 440 460 480 490 760 720 Savings and money market 320 290 290 300 300 300 380 660 740 Certificates of deposit 590 580 650 720 740 670 610 930 950 ($ in millions) |
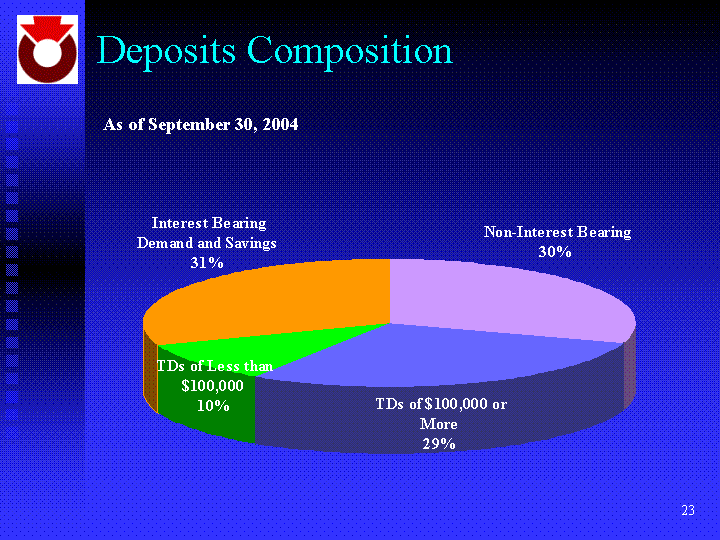
| Deposits Composition Non-Interest Bearing 721959 TDs of $100,000 or More 701055 TDs of Less than $100,000 245597 Interest Bearing Demand and Savings 736052 As of September 30, 2004 |
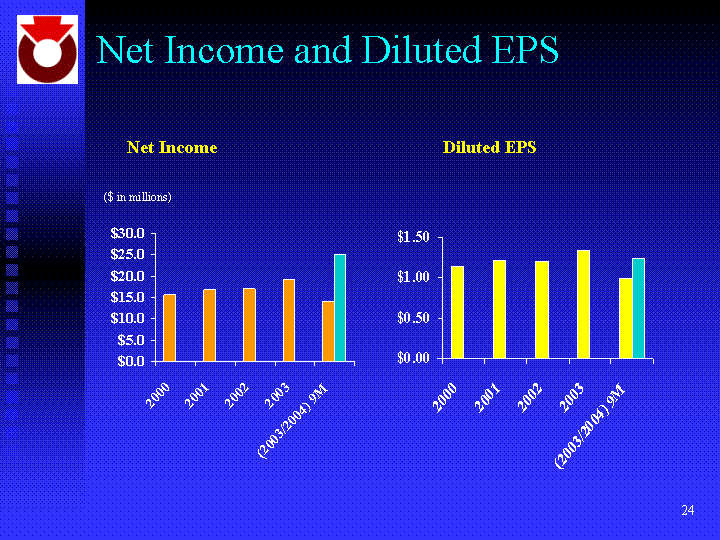
| Net Income and Diluted EPS Diluted EPS 2000 2001 2002 2003 (2003/2004) 9M Net Income 15.5 16.8 17 19.2 14.1 25 Net Income ($ in millions) 2000 2001 2002 2003 (2003/2004) 9M Diluted EPS 1.14 1.21 1.2 1.34 0.99 1.23 |
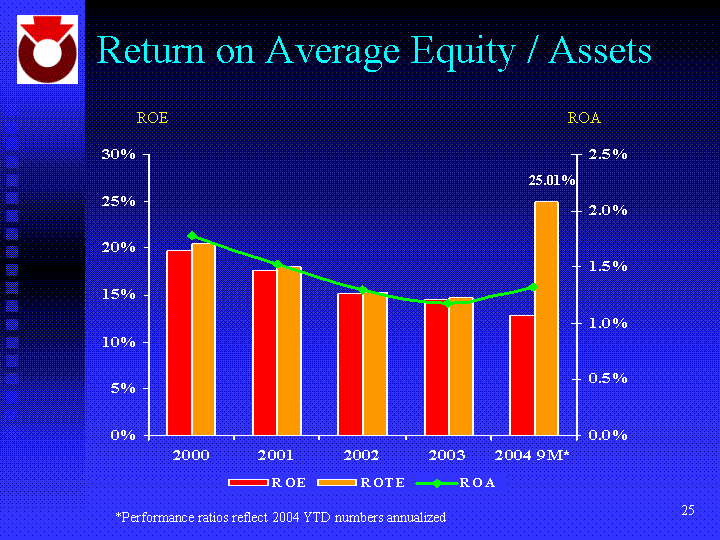
| Return on Average Equity / Assets ROA ROE 2000 2001 2002 2003 2004 9M* ROE 0.1981 0.1756 0.1508 0.1451 0.1285 ROA 0.0178 0.0153 0.013 0.0118 0.0132 ROTE 0.2045 0.1798 0.1535 0.1475 0.2501 25.01% *Performance ratios reflect 2004 YTD numbers annualized |
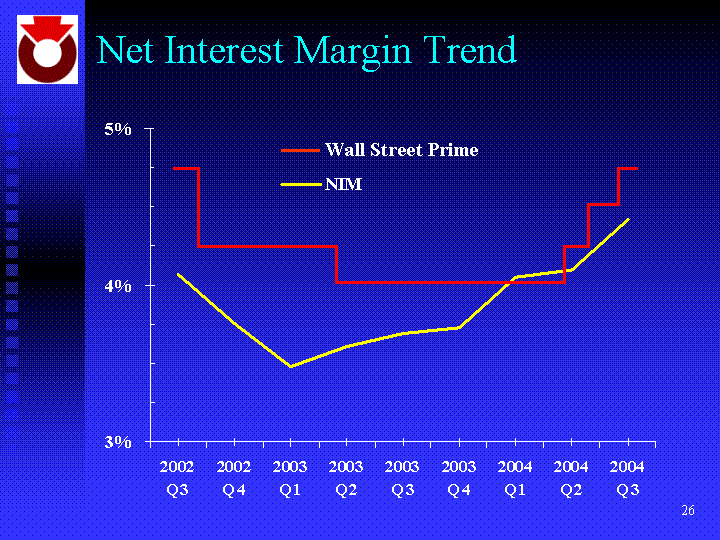
| Net Interest Margin Trend 2002 Q3 2002 Q4 2003 Q1 2003 Q2 2003 Q3 2003 Q4 2004 Q1 2004 Q2 2004 Q3 NIM 0.0407 0.0376 0.0348 0.0361 0.0369 0.0373 0.0405 0.041 0.0442 Wall Street Prime |
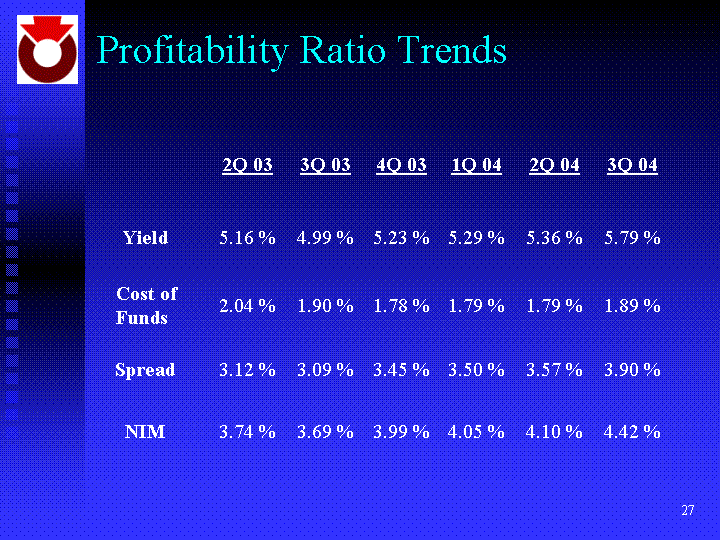
| Profitability Ratio Trends 2Q 03 3Q 03 4Q 03 1Q 04 2Q 04 3Q 04 Yield 5.16 % 4.99 % 5.23 % 5.29 % 5.36 % 5.79 % Cost of Funds 2.04 % 1.90 % 1.78 % 1.79 % 1.79 % 1.89 % Spread 3.12 % 3.09 % 3.45 % 3.50 % 3.57 % 3.90 % NIM 3.74 % 3.69 % 3.99 % 4.05 % 4.10 % 4.42 % |
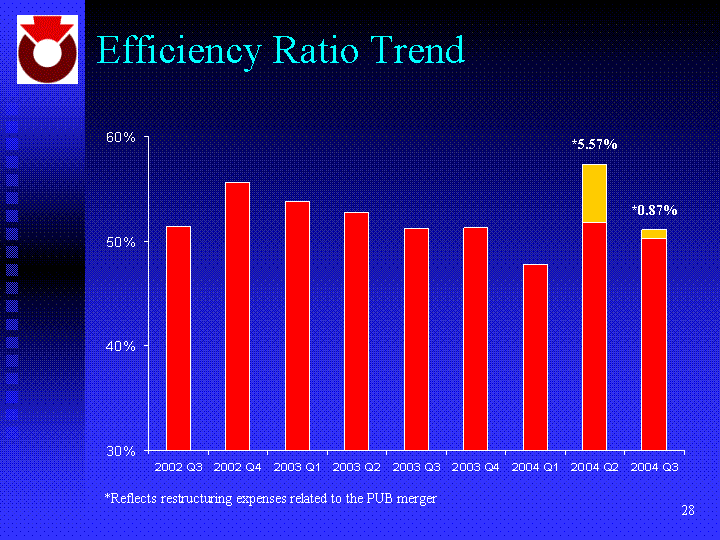
| Efficiency Ratio Trend *5.57% *Reflects restructuring expenses related to the PUB merger 2002 Q3 2002 Q4 2003 Q1 2003 Q2 2003 Q3 2003 Q4 2004 Q1 2004 Q2 2004 Q3 Efficiency Ratio 0.5147 0.5565 0.5374 0.528 0.5123 0.5131 0.4777 0.5181 0.5029 Acquisition 0 0 0 0 0 0 0 0.0557 0.0087 *0.87% |
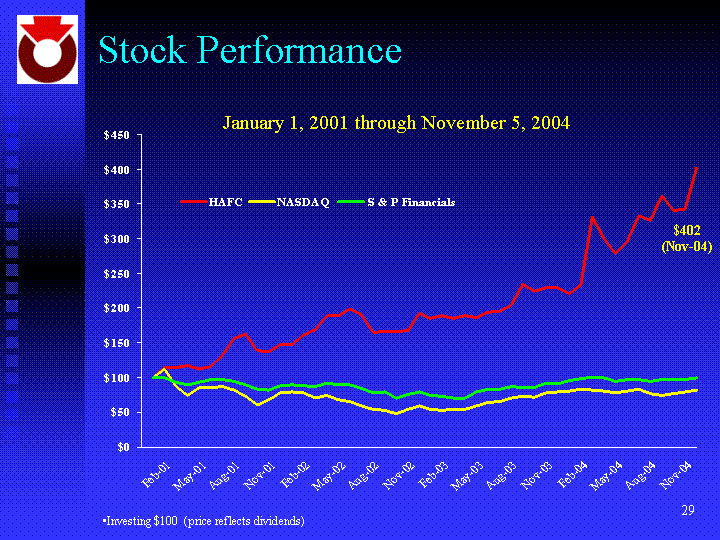
| Stock Performance Investing $100 (price reflects dividends) HAFC NASDAQ S & P Financials 12/1/00 100 100 100 20.4 1/1/04 115.11 112.23 99.57 31.6 2/1/04 115.11 87.1 92.89 43.9 3/1/04 117.02 74.49 90 4/1/04 111.95 85.66 93.22 5/1/04 116.01 85.43 96.79 6/1/04 131.91 87.45 96.67 7/1/04 156.71 82.05 94.98 8/1/04 162.46 73.08 89.05 9/1/04 138.44 60.67 83.67 10/1/04 137.43 68.41 81.98 11/1/04 147.46 78.14 87.7 12/1/04 147.58 78.95 89.47 1/2/04 160.77 78.28 87.88 2/2/04 168.43 70.09 86.47 3/2/04 188.61 74.69 92.12 4/2/04 189.18 68.34 89.53 5/2/04 199.66 65.4 89.24 6/2/04 190.08 59.23 84.85 7/2/04 165.61 53.76 77.99 12/1/00 1/1/01 2/1/01 3/1/01 4/1/01 5/1/01 6/1/01 7/1/01 8/1/01 9/1/01 10/1/01 11/1/01 12/1/01 1/1/02 2/1/02 3/2/02 4/29/02 5/28/02 6/26/02 7/25/02 8/23/02 9/21/02 10/20/02 11/18/02 12/17/02 1/15/03 2/13/03 3/14/03 4/14/03 5/14/03 6/14/03 7/14/03 8/14/03 9/14/03 10/1/03 11/3/03 12/1/03 1/2/04 2/2/04 3/1/04 4/1/04 5/3/04 6/4/04 7/4/04 8/4/04 9/30/04 10/30/04 11/5/04 HAFC 100 115.11 115.11 117.02 111.95 116.01 131.91 156.71 162.46 138.44 137.43 147.46 147.58 160.77 168.43 188.61 189.18 199.66 190.08 165.61 166.97 166.4 167.76 192.78 184.78 189.29 185.46 189.63 186.36 194.25 195.72 204.74 234.27 224.01 229.65 229.99 221.2 232.81 331.45 299.66 278.47 295.94 332.58 326.94 361.67 340.47 342.5 401.92 NASDAQ 100 112.23 87.1 74.49 85.66 85.43 87.45 82.05 73.08 60.67 68.41 78.14 78.95 78.28 70.09 74.69 68.34 65.4 59.23 53.76 53.22 47.44 53.82 59.86 54.06 53.47 54.14 54.29 59.27 64.6 65.69 70.23 73.28 72.33 78.21 79.35 81.09 83.63 82.16 80.72 77.72 80.42 82.89 76.4 74.4 76.78 79.94 82.53 S & P Financials 100 99.57 92.89 90 93.22 96.79 96.67 94.98 89.05 83.67 81.98 87.7 89.47 87.88 86.47 92.12 89.53 89.24 84.85 77.99 79.44 70.01 76.17 79.16 74.77 73.36 70.95 70.53 79.03 83.04 83.1 86.69 85.67 86.08 91.78 91.37 95.65 98.47 100.94 99.75 94.9 96.52 96.8 94.56 97.6 96.57 96.79 99.62 January 1, 2001 through November 5, 2004 $402 (Nov-04) |
| Business Initiatives: 2004-2005 Continue focus on profitability Completion of PUB merger integration Business relationship expansion through strategic alliances with major Korean banks Maximize corporate/shareholder value |
| Compelling Investment Opportunity Dominant franchise in the attractive, high growth California-based Korean-American marketplace Experienced management team partnered with Castle Creek's proven capability integrating and operating highly profitable commercial banks Robust loan growth coupled with attractive core deposit franchise Balance sheet well positioned to take advantage of a rising interest rate environment |