
| KBW's Regional Bank Conference February 28, 2007 |

| Certain statements contained in this presentation, including, without limitation, statements containing the words "believes," "plans," "expects," "anticipates," and words of similar import, constitute "forward-looking statements" within the meaning of the Private Securities Litigation Reform Act of 1995. Such forward-looking statements involve known and unknown risks, uncertainties and other factors that may cause the actual results, performance or achievements of the Company to be materially different from any future results, performance or achievements expressed or implied by such forward-looking statements. Such factors include, among others, the following: general economic and business conditions in those areas in which the Company operates; demographic changes; competition; fluctuations in market interest rates; changes in credit quality; and other risks detailed in the most recent quarterly and annual reports filed with the Securities Exchange Commission, including the Company's Form 10-K for the year ended December 31, 2005, Form 10-Q for the quarter ended September 30, 2006 and other filings. Given these uncertainties, undue reliance should not be placed on such forward-looking statements. The Company disclaims any obligation to update any such factors or to publicly announce the results of any revisions to any of the forward-looking statements contained herein to reflect future events or developments. Safe Harbor Statement |
| Korea-American market nine-year history - Loans: 26% CAGR - Deposits: 23% CAGR 40% of 2.2 million Korean-American population reside in California Highest rates of business ownership with one per every eight Korean-Americans High savings rate Korean-American Market (Source: US Korean Embassy and 2001 SBA Report) |
| Increased wealth in Korean-American community Korea is the 11th largest economy with $17 billion current account surplus in 2005 Continuing immigration trend from Korea Wealthier and better educated recent immigrants Korea recently relaxed restrictions on overseas investment Target Market Growth Drivers |
| Expertise in serving ethnic immigrant market Expertise in real estate lending Expertise in small business lending Hanmi's Core Competencies |
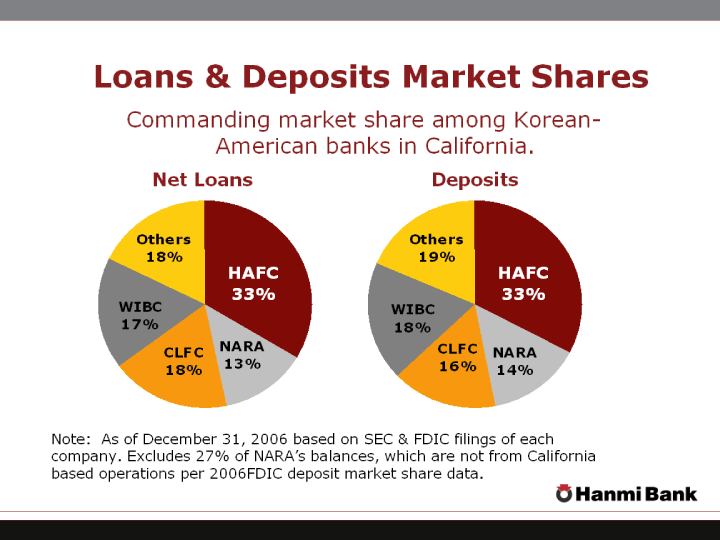
| Commanding market share among Korean- American banks in California. Loans & Deposits Market Shares HAFC 2944.7 NARA 1279 CLFC 1429.4 WIBC 1661 Others 1682.1 Deposits Net Loans Note: As of December 31, 2006 based on SEC & FDIC filings of each company. Excludes 27% of NARA's balances, which are not from California based operations per 2006FDIC deposit market share data. HAFC 2837.4 NARA 1126 CLFC 1518.7 WIBC 1491 Others 1496.7 |

| Experienced Management Team Name Title Banking Experience Sung Won Sohn, Ph. D. President and CEO 33 years Kurt M. Wegleitner EVP and CCO 27 years Michael J. Winiarski SVP and CFO 27 years |
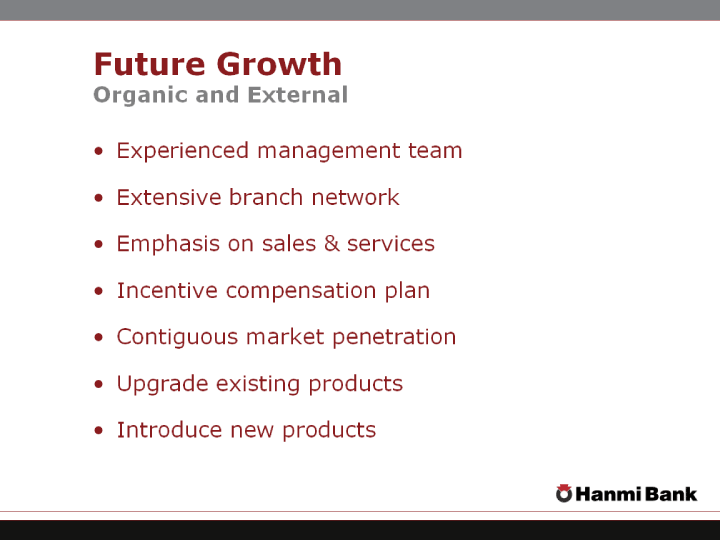
| Experienced management team Extensive branch network Emphasis on sales & services Incentive compensation plan Contiguous market penetration Upgrade existing products Introduce new products Future Growth Organic and External |
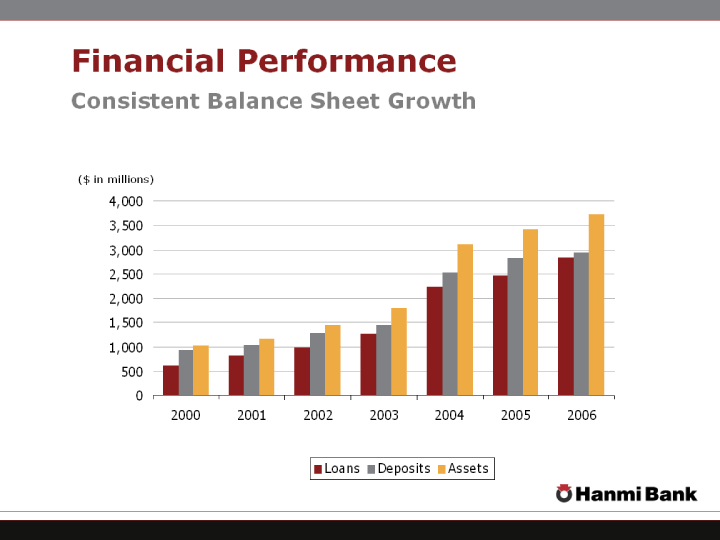
| Financial Performance Consistent Balance Sheet Growth 2000 2001 2002 2003 2004 2005 2006 Loans 620 820 1000 1270 2235 2469 2837 Deposits 940 1040 1290 1450 2529 2826 2945 Assets 1030 1160 1460 1790 3104 3414 3725 ($ in millions) |
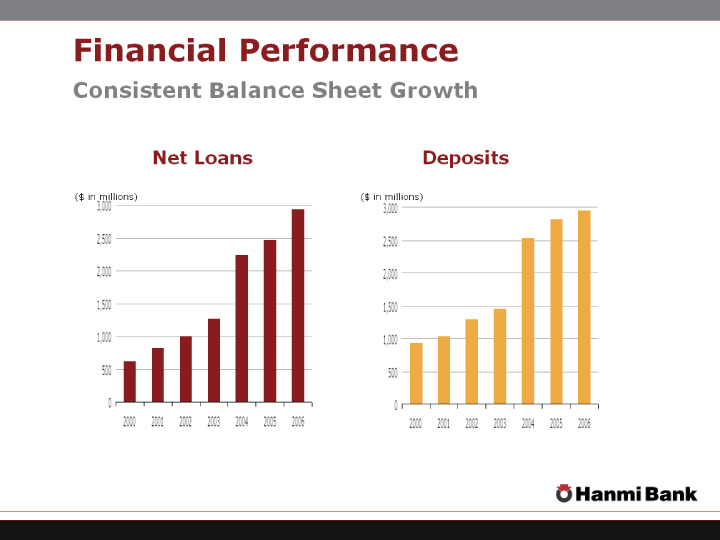
| Financial Performance Consistent Balance Sheet Growth 2000 2001 2002 2003 2004 2005 2006 Loans 620 820 1000 1270 2235 2469 2937.4 ($ in millions) 2000 2001 2002 2003 2004 2005 2006 Deposits 940 1040 1290 1450 2529 2826 2944.7 Net Loans Deposits ($ in millions) |
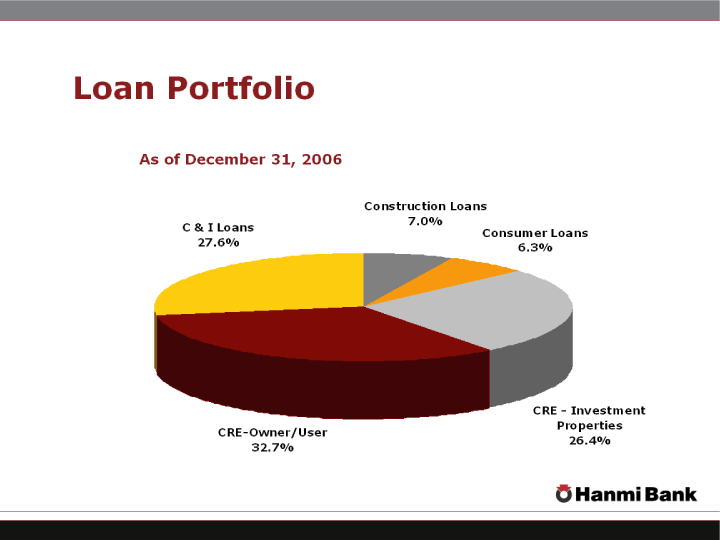
| Loan Portfolio Construction Loans 202 Consumer Loans 182 CRE-Investment Propertirs 757 CRE-Owner/User 938 C & I Loans 792 As of December 31, 2006 |
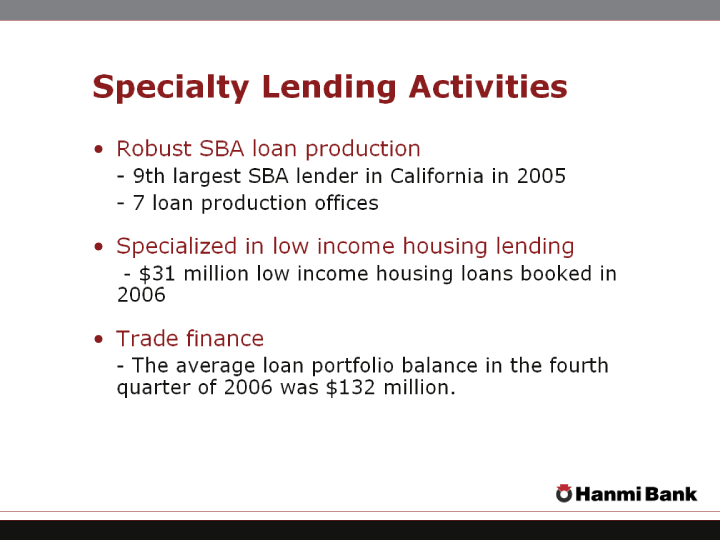
| Robust SBA loan production - 9th largest SBA lender in California in 2005 - 7 loan production offices Specialized in low income housing lending - $31 million low income housing loans booked in 2006 Trade finance - The average loan portfolio balance in the fourth quarter of 2006 was $132 million. Specialty Lending Activities |
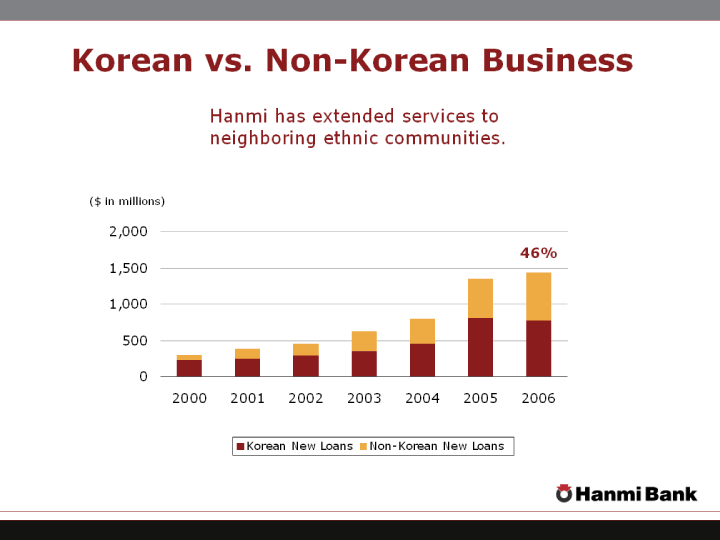
| Korean vs. Non-Korean Business 2000 2001 2002 2003 2004 2005 2006 Korean New Loans 221.1 245.7 287.4 344.5 452.4 800.8 774 Non-Korean New Loans 75.4 136.3 165.5 278.4 339.3 548.3 665 Hanmi has extended services to neighboring ethnic communities. ($ in millions) 46% |
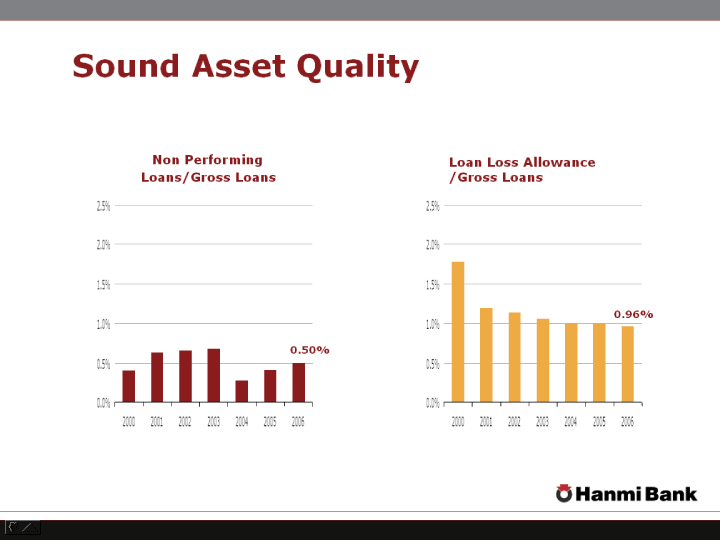
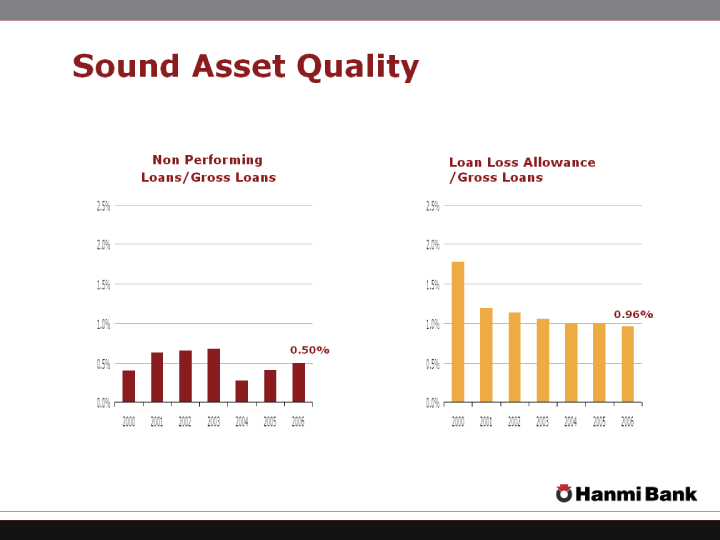
| Sound Asset Quality 2000 2001 2002 2003 2004 2005 2006 Hanmi 0.004 0.0063 0.0065 0.0068 0.0027 0.0041 0.005 Non Performing Loans/Gross Loans 2000 2001 2002 2003 2004 2005 2006 Hanmi 0.0178 0.0119 0.0114 0.0106 0.01 0.01 0.0096 Loan Loss Allowance /Gross Loans 0.96% 0.50% |
| Deposits Composition Non-Interest Bearing 728 TDs of $100,000 or More 1383 TDs of Less than $100,000 296 Interest Bearing Demand and Savings 537 As of December 31, 2006 |
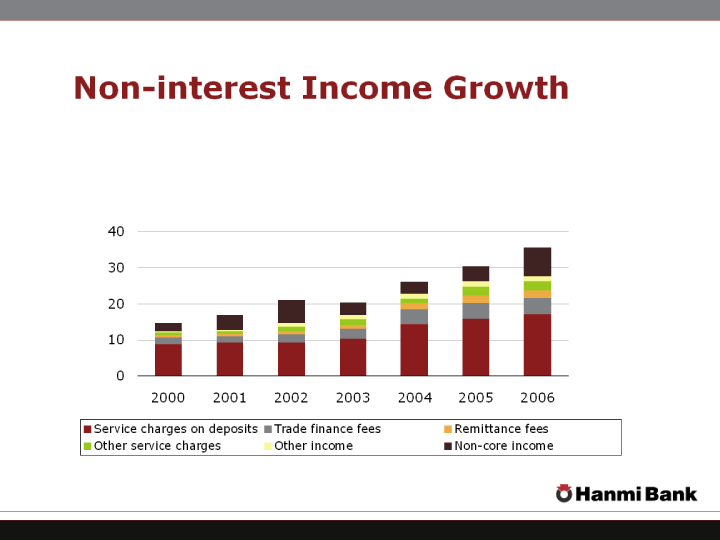
| Non-interest Income Growth 2000 2001 2002 2003 2004 2005 2006 Service charges on deposits 8.9 9.2 9.2 10.3 14.4 15.8 17.1 Trade finance fees 1.9 1.9 2.4 2.9 4 4.3 4.6 Remittance fees 0.5 0.6 0.8 1 1.7 2.1 2.1 Other service charges 0.8 0.8 1.1 1.5 1.5 2.5 2.4 Other income 0.4 0.4 1.2 1.3 1.2 1.5 1.5 Non-core income 2.3 4 6.5 3.3 3.3 4.2 8 |
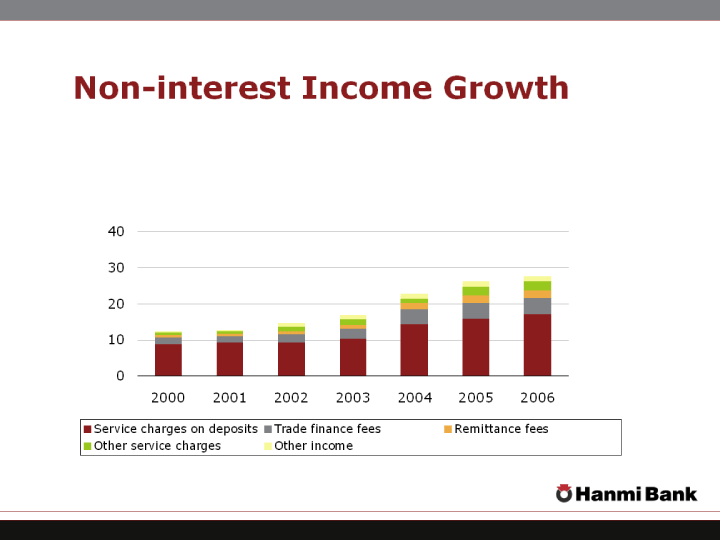
| Non-interest Income Growth 2000 2001 2002 2003 2004 2005 2006 Service charges on deposits 8.9 9.2 9.2 10.3 14.4 15.8 17.1 Trade finance fees 1.9 1.9 2.4 2.9 4 4.3 4.6 Remittance fees 0.5 0.6 0.8 1 1.7 2.1 2.1 Other service charges 0.8 0.8 1.1 1.5 1.5 2.5 2.4 Other income 0.4 0.4 1.2 1.3 1.2 1.5 1.5 |
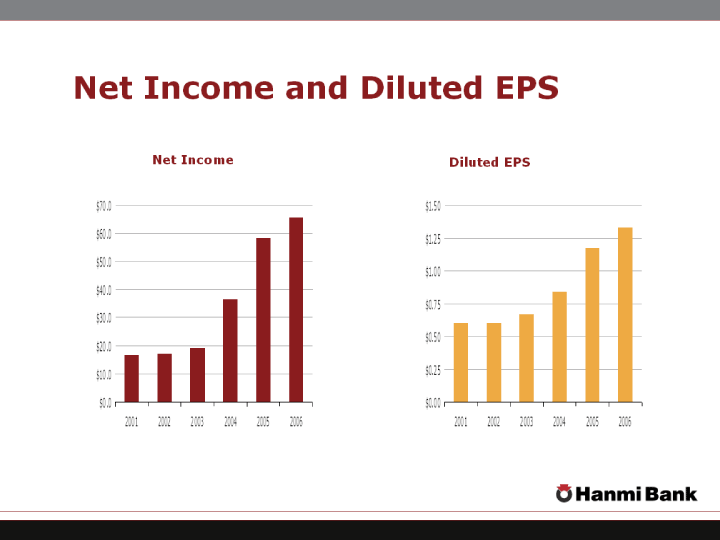
| Net Income and Diluted EPS 2001 2002 2003 2004 2005 2006 Net Income 16.8 17 19.2 36.7 58.2 65.6 Net Income 2001 2002 2003 2004 2005 2006 Diluted EPS 0.6 0.6 0.67 0.84 1.17 1.33 Diluted EPS |
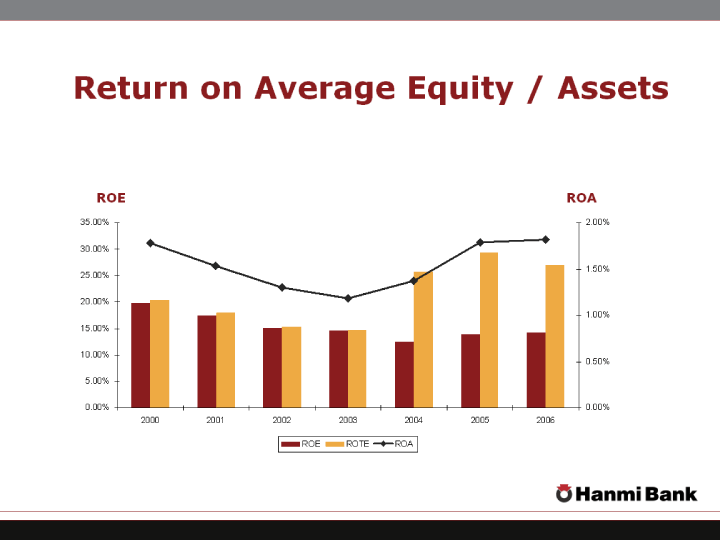
| Return on Average Equity / Assets 2000 2001 2002 2003 2004 2005 2006 ROE 0.1981 0.1756 0.1508 0.1451 0.1251 0.1394 0.1433 ROA 0.0178 0.0153 0.013 0.0118 0.0137 0.0179 0.0182 ROTE 0.2045 0.1798 0.1535 0.1475 0.2573 0.2933 0.2709 ROE ROA |
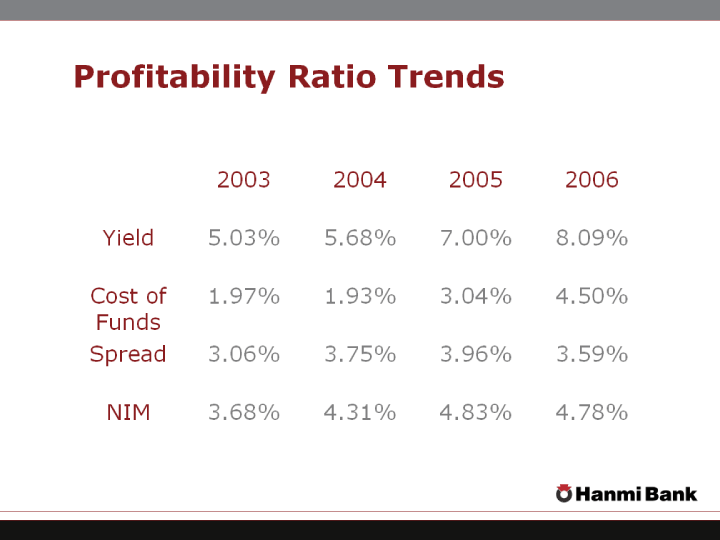
| Profitability Ratio Trends 2003 2004 2005 2006 Yield 5.03% 5.68% 7.00% 8.09% Cost of Funds 1.97% 1.93% 3.04% 4.50% Spread 3.06% 3.75% 3.96% 3.59% NIM 3.68% 4.31% 4.83% 4.78% |
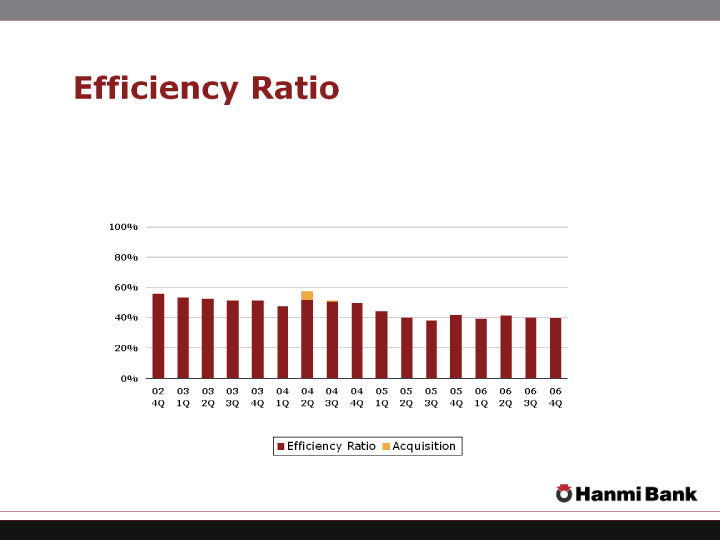
| Efficiency Ratio 02 4Q 03 1Q 03 2Q 03 3Q 03 4Q 04 1Q 04 2Q 04 3Q 04 4Q 05 1Q 05 2Q 05 3Q 05 4Q 06 1Q 06 2Q 06 3Q 06 4Q Efficiency Ratio 0.5565 0.5374 0.528 0.5123 0.5131 0.4777 0.5181 0.5029 0.4951 0.4438 0.403 0.3834 0.4193 0.391 0.4159 0.4014 0.3959 Acquisition 0 0 0 0 0 0 0.0557 0.0087 |
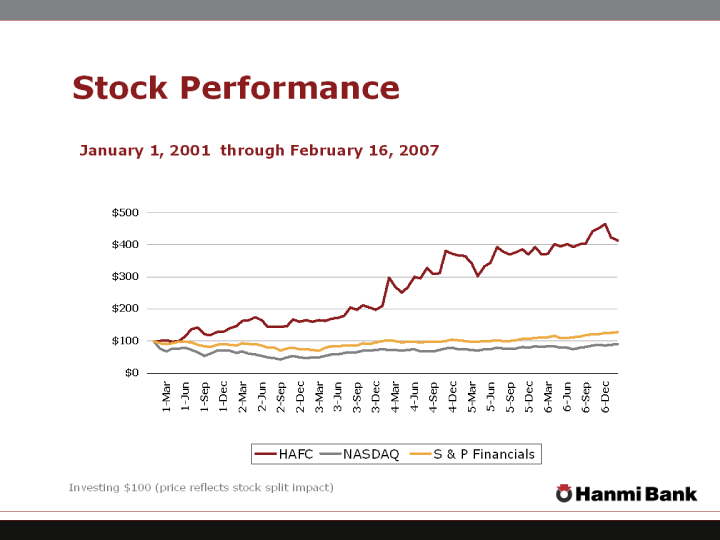
| Stock Performance 1/1/2007 2/1/2007 3/1/2007 4/1/2007 5/1/2007 6/1/2007 7/1/2007 8/1/2007 9/1/2007 10/1/2007 11/1/2007 12/1/2007 1/2/2007 2/2/2007 3/2/2007 4/2/2007 5/2/2007 6/2/2007 7/2/2007 8/2/2007 9/2/2007 10/2/2007 11/2/2007 12/2/2007 1/3/2007 2/3/2007 3/3/2007 4/3/2007 5/3/2007 6/3/2007 7/3/2007 8/3/2007 9/3/2007 10/3/2007 11/3/2007 12/3/2007 1/4/2007 2/4/2007 3/4/2007 4/4/2007 5/4/2007 6/4/2007 7/4/2007 8/4/2007 9/4/2007 10/4/2007 11/4/2007 12/4/2007 1/5/2007 2/5/2007 3/5/2007 4/5/2007 5/5/2007 6/5/2007 7/5/2007 8/5/2007 9/5/2007 10/5/2007 11/5/2007 12/5/2007 1/6/2007 2/6/2007 3/6/2007 4/6/2007 5/6/2007 6/6/2007 7/6/2007 8/6/2007 9/6/2007 10/6/2007 11/6/2007 12/6/2007 1/7/2007 2/7/2007 HAFC 100 100 101.65 97.11 100.83 114.67 136.16 141.12 120.25 119.21 128.1 128.1 139.67 146.28 163.84 164.26 173.35 165.08 143.8 145.04 144.42 145.66 167.36 160.54 164.46 161.16 165.7 162.81 169.63 171.9 179.75 205.79 197.73 210.95 205.58 198.76 209.09 297.73 270.25 251.03 266.94 301.03 295.87 327.48 310.33 312.19 382.02 371.28 366.94 365.5 341.94 302.69 332.02 345.04 392.56 379.13 370.87 377.69 384.92 369.01 392.36 370.87 373.14 402.48 396.07 401.65 393.39 403.31 404.96 441.53 451.03 465.5 423.14 414.67 NASDAQ 100 77.61 66.37 76.32 76.12 77.92 73.11 65.11 54.06 60.96 69.63 70.34 69.75 62.45 66.55 60.89 58.27 52.77 47.9 47.42 42.27 47.96 53.33 48.17 47.64 48.24 48.37 52.81 57.56 58.53 62.57 65.29 64.45 69.69 70.7 72.25 74.52 73.21 71.92 69.25 71.65 73.85 68.07 66.29 68.41 71.23 75.62 78.46 74.38 74 72.1 69.31 74.59 74.19 78.8 77.62 77.6 76.47 80.53 79.54 83.16 82.28 84.39 83.76 78.58 78.34 75.53 78.76 81.45 85.36 87.7 87.11 88.86 90.03 S & P Financials 100 93.29 90.39 93.62 97.21 97.09 95.39 89.43 84.03 82.34 88.07 89.85 88.26 86.85 92.52 89.92 89.62 85.22 78.32 79.78 70.31 76.5 79.51 75.09 73.68 71.26 70.84 79.37 83.4 83.46 87.06 86.04 86.45 92.17 91.76 96.06 98.9 101.38 100.18 95.31 96.93 97.22 94.97 98.02 96.99 97.21 99.91 103.97 101.56 100.79 96.73 96.57 99.06 100.26 101.57 99.53 100.33 103.32 107.73 107.85 108.63 110.56 110.64 115.13 109.94 109.8 112.33 113.22 117.82 120.49 120.76 125.27 126.15 128.29 January 1, 2001 through February 16, 2007 Investing $100 (price reflects stock split impact) |
| Dominant franchise in the attractive, high growth California-based Korean-American marketplace Proven expertise serving growing immigrant markets Experienced management team High quality loan portfolio coupled with attractive core deposit franchise Compelling Investment Opportunity |