
Exhibit 99.1
Piper Sandler California Community Bank Tour October 2022 Los Angeles New York/ New Jersey Virginia Chicago Dallas Houston San Francisco San Diego
Hanmi Financial Corporation (the “Company”) cautions investors that any statements contained herein that are not historical facts are forward - looking statements within the meaning of the “safe harbor” provisions of the Private Securities Litigation Reform Act of 1995 , including, but not limited to, those statements regarding operating and financial performance, financial position and liquidity, business strategies, regulatory, economic and competitive outlook, investment and expenditure plans, capital and financing needs and availability, litigation, plans and objectives, merger or sale activity, the effects of COVID - 19 on our business, financial condition and results of operations, and all other forecasts and statements of expectation or assumption underlying any of the foregoing . These statements involve known and unknown risks and uncertainties that are difficult to predict . Investors should not rely on any forward - looking statement and should consider risks, such as changes in governmental policy, legislation and regulations, economic uncertainty, inflation, the continuing impact of the COVID - 19 pandemic on our business and results of operations, fluctuations in interest rate and credit risk, competitive pressures, the ability to succeed in new markets, balance sheet management, the ability to identify and remediate any material weakness in internal controls over financial reporting, and other operational factors . Forward - looking statements are based upon the good faith beliefs and expectations of management as of this date only and are further subject to additional risks and uncertainties, including, but not limited to, the risk factors set forth in our earnings release dated October 25 , 2022 , including the section titled “Forward Looking Statements and the Company’s most recent Form 10 - K, 10 - Q and other filings with the Securities and Exchange Commission (“SEC”) . Investors are urged to review our earnings release dated October 25 , 2022 , including the section titled “Forward Looking Statements and the Company’s SEC filings . The Company disclaims any obligation to update or revise the forward - looking statements herein . 2 Forward - Looking Statements
This presentation contains financial information determined by methods other than in accordance with accounting principles generally accepted in the United States of America (“GAAP”) . These non - GAAP measures include tangible common equity to tangible assets, allowance for credit losses to loans receivable adjusted for PPP loans, net interest margin adjusted for PPP loans, and efficiency ratio adjusted for PPP loans and securities losses . Management uses these “non - GAAP” measures in its analysis of the Company’s performance . Management believes these non - GAAP financial measures allow for better comparability of period to period operating performance . Additionally, the Company believes this information is utilized by regulators and market analysts to evaluate a company’s financial condition and therefore, such information is useful to investors . These disclosures should not be viewed as a substitute for operating results determined in accordance with GAAP, nor are they necessarily comparable to non - GAAP performance measures that may be presented by other companies . A reconciliation of the non - GAAP measures used in this presentation to the most directly comparable GAAP measures is provided in the Appendix to this presentation . 3 Non - GAAP Financial Information
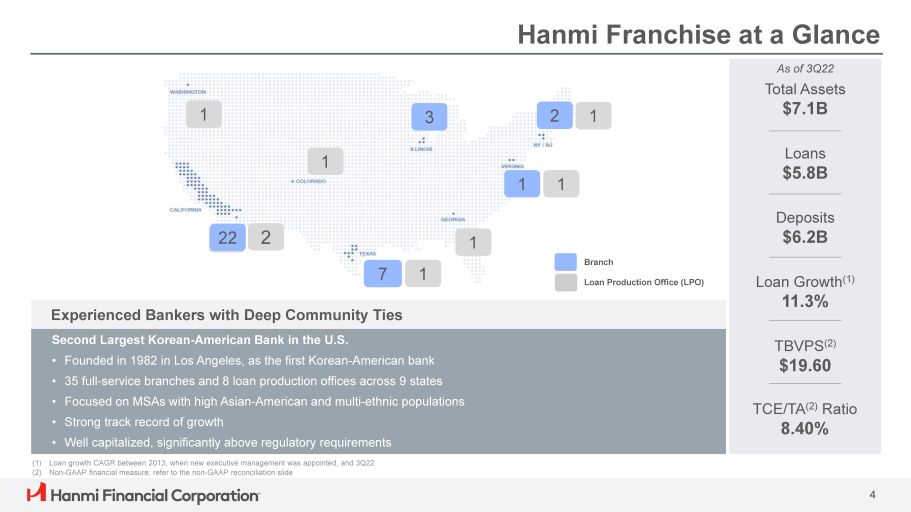
Hanmi Franchise at a Glance Loans $5.8B Deposits $6.2B TCE/TA (2) Ratio 8.40% Second Largest Korean - American Bank in the U.S. • Founded in 1982 in Los Angeles, as the first Korean - American bank • 35 full - service branches and 8 loan production offices across 9 states • Focused on MSAs with high Asian - American and multi - ethnic populations • Strong track record of growth • Well capitalized, significantly above regulatory requirements (1) Loan growth CAGR between 2013, when new executive management was appointed, and 3Q22 (2) Non - GAAP financial measure; refer to the non - GAAP reconciliation slide Loan Growth (1) 11.3% TBVPS (2) $19.60 As of 3Q22 Total Assets $7.1B Experienced Bankers with Deep Community Ties 3 2 1 1 1 1 7 1 1 Branch Loan Production Office (LPO) 1 2 2 2 2 4
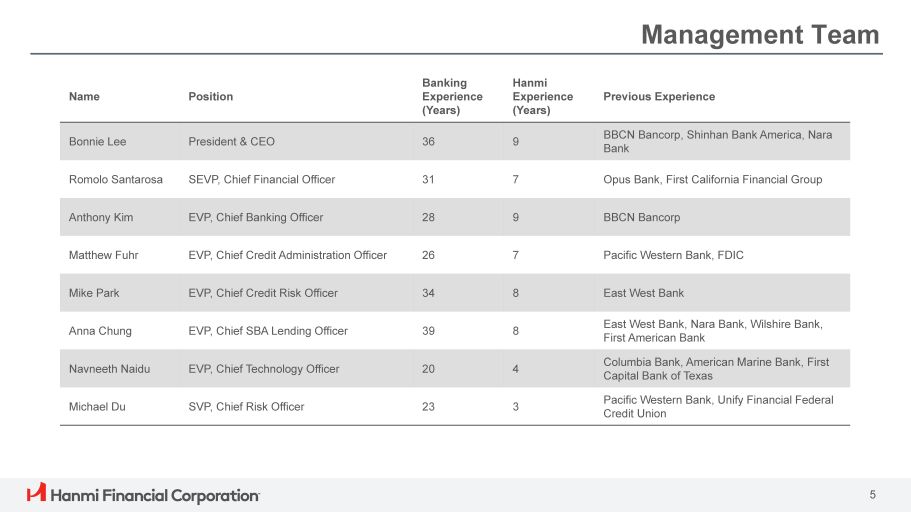
Name Position Banking Experience (Years) Hanmi Experience (Years) Previous Experience Bonnie Lee President & CEO 36 9 BBCN Bancorp, Shinhan Bank America, Nara Bank Romolo Santarosa SEVP, Chief Financial Officer 31 7 Opus Bank, First California Financial Group Anthony Kim EVP, Chief Banking Officer 28 9 BBCN Bancorp Matthew Fuhr EVP, Chief Credit Administration Officer 26 7 Pacific Western Bank, FDIC Mike Park EVP, Chief Credit Risk Officer 34 8 East West Bank Anna Chung EVP, Chief SBA Lending Officer 39 8 East West Bank, Nara Bank, Wilshire Bank, First American Bank Navneeth Naidu EVP, Chief Technology Officer 20 4 Columbia Bank, American Marine Bank, First Capital Bank of Texas Michael Du SVP, Chief Risk Officer 23 3 Pacific Western Bank, Unify Financial Federal Credit Union 5 Management Team
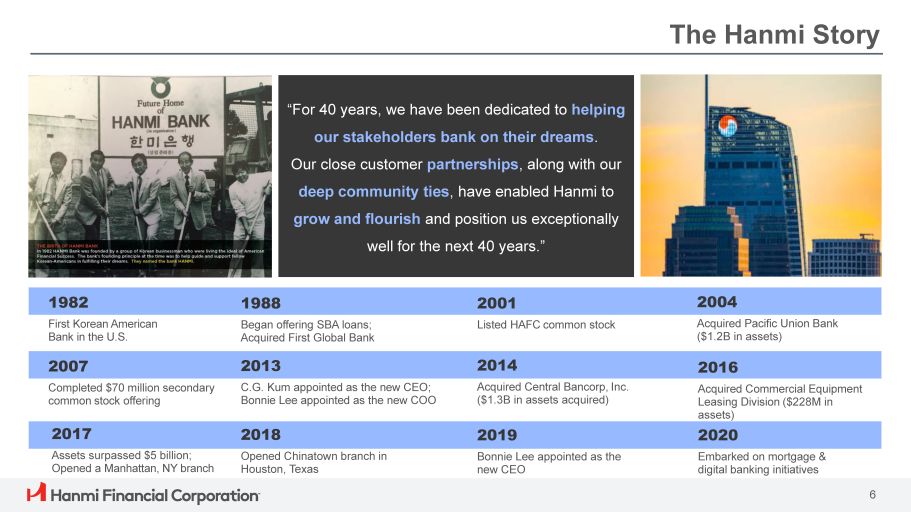
The Hanmi Story “For 40 years, we have been dedicated to helping our stakeholders bank on their dreams . Our close customer partnerships , along with our deep community ties , have enabled Hanmi to grow and flourish and position us exceptionally well for the next 40 years.” 1982 1988 2001 2004 First Korean American Bank in the U.S. Began offering SBA loans; Acquired First Global Bank Listed HAFC common stock Acquired Pacific Union Bank ($1.2B in assets) 2007 2013 2014 2016 Completed $70 million secondary C.G. Kum appointed as the new CEO; Acquired Central Bancorp, Inc. Acquired Commercial Equipment common stock offering Bonnie Lee appointed as the new COO ($1.3B in assets acquired) Leasing Division ($228M in assets) 2017 2018 2019 2020 Assets surpassed $5 billion; Opened Chinatown branch in Bonnie Lee appointed as the Embarked on mortgage & Opened a Manhattan, NY branch Houston, Texas new CEO digital banking initiatives 6
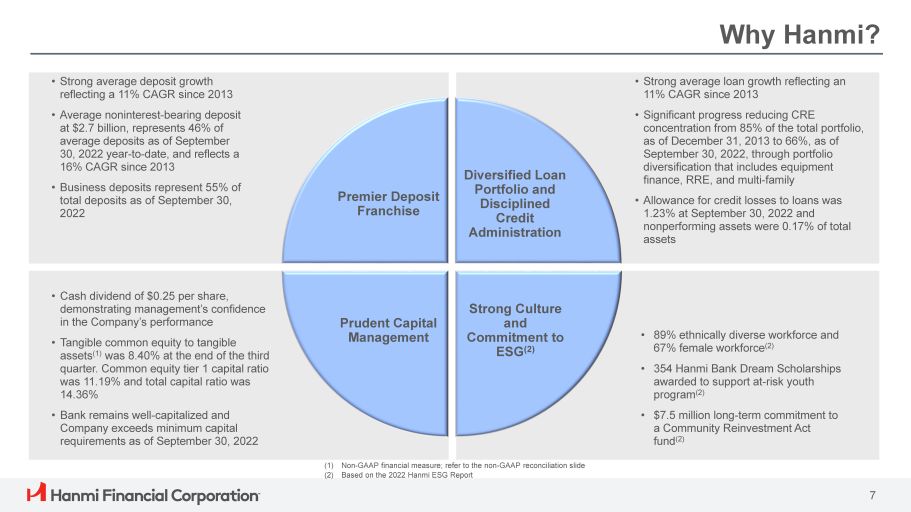
Why Hanmi? • Strong average loan growth reflecting an 11% CAGR since 2013 • Significant progress reducing CRE concentration from 85% of the total portfolio, as of December 31, 2013 to 66%, as of September 30, 2022, through portfolio diversification that includes equipment finance, RRE, and multi - family • Allowance for credit losses to loans was 1.23% at September 30, 2022 and nonperforming assets were 0.17% of total assets • Strong average deposit growth reflecting a 11% CAGR since 2013 • Average noninterest - bearing deposit at $2.7 billion, represents 46% of average deposits as of September 30, 2022 year - to - date, and reflects a 16% CAGR since 2013 • Business deposits represent 55% of total deposits as of September 30, 2022 Premier Deposit Franchise Diversified Loan Portfolio and Disciplined Credit Administration 7 Strong Culture and Commitment to ESG (2) Prudent Capital Management • Cash dividend of $0.25 per share, demonstrating management’s confidence in the Company’s performance • Tangible common equity to tangible assets (1) was 8.40% at the end of the third quarter. Common equity tier 1 capital ratio was 11.19% and total capital ratio was 14.36% • Bank remains well - capitalized and Company exceeds minimum capital requirements as of September 30, 2022 • 89% ethnically diverse workforce and 67% female workforce (2) • 354 Hanmi Bank Dream Scholarships awarded to support at - risk youth program (2) • $7.5 million long - term commitment to a Community Reinvestment Act fund (2) (1) Non - GAAP financial measure; refer to the non - GAAP reconciliation slide (2) Based on the 2022 Hanmi ESG Report
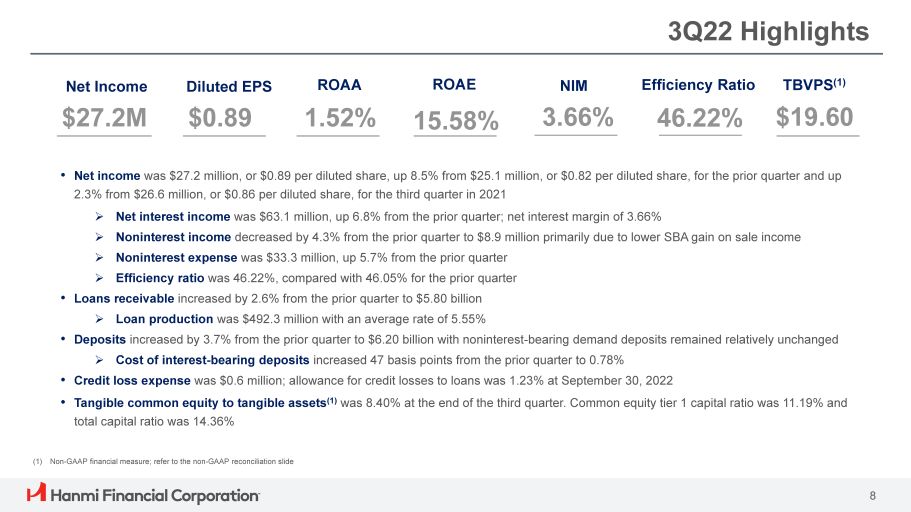
3Q22 Highlights Diluted EPS $0.89 ROAA 1.52% NIM 3.66% Efficiency Ratio 46.22% TBVPS (1) $19.60 Net Income $27.2M • Net income was $27.2 million, or $0.89 per diluted share, up 8.5% from $25.1 million, or $0.82 per diluted share, for the prior quarter and up 2.3% from $26.6 million, or $0.86 per diluted share, for the third quarter in 2021 » Net interest income was $63.1 million, up 6.8% from the prior quarter; net interest margin of 3.66% » Noninterest income decreased by 4.3% from the prior quarter to $8.9 million primarily due to lower SBA gain on sale income » Noninterest expense was $33.3 million, up 5.7% from the prior quarter » Efficiency ratio was 46.22%, compared with 46.05% for the prior quarter • Loans receivable increased by 2.6% from the prior quarter to $5.80 billion » Loan production was $492.3 million with an average rate of 5.55% • Deposits increased by 3.7% from the prior quarter to $6.20 billion with noninterest - bearing demand deposits remained relatively unchanged » Cost of interest - bearing deposits increased 47 basis points from the prior quarter to 0.78% • Credit loss expense was $0.6 million; allowance for credit losses to loans was 1.23% at September 30, 2022 • Tangible common equity to tangible assets (1) was 8.40% at the end of the third quarter. Common equity tier 1 capital ratio was 11.19% and total capital ratio was 14.36% ROAE 15.58% (1) Non - GAAP financial measure; refer to the non - GAAP reconciliation slide 8
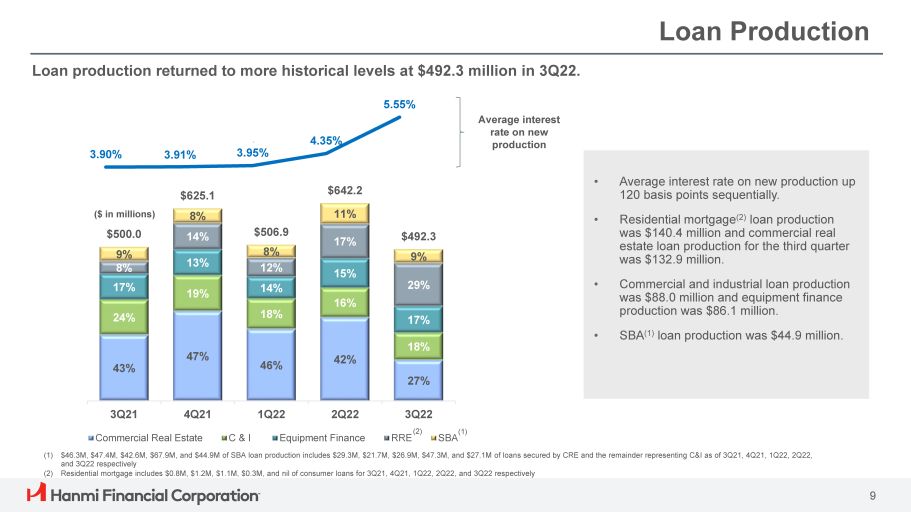
Loan Production 43% 47% 46% 42% 27% 24% 19% 18% 16% 18% 13% 15% 17% 17% 29% 11% $625.1 8% 14% $506.9 8% 12% 14% $492.3 9% ($ in millions) $500.0 9% 8% 17% $642.2 3Q21 4Q21 Commercial Real Estate C & I 1Q22 2Q22 Equipment Finance 3Q22 (2) RRE (1) SBA • Average interest rate on new production up 120 basis points sequentially. • Residential mortgage (2) loan production was $140.4 million and commercial real estate loan production for the third quarter was $132.9 million. • Commercial and industrial loan production was $88.0 million and equipment finance production was $86.1 million. • SBA (1) loan production was $44.9 million. Average interest rate on new production (1) $46.3M, $47.4M, $42.6M, $67.9M, and $44.9M of SBA loan production includes $29.3M, $21.7M, $26.9M, $47.3M, and $27.1M of loans secured by CRE and the remainder representing C&I as of 3Q21, 4Q21, 1Q22, 2Q22, and 3Q22 respectively (2) Residential mortgage includes $0.8M, $1.2M, $1.1M, $0.3M, and nil of consumer loans for 3Q21, 4Q21, 1Q22, 2Q22, and 3Q22 respectively 3.90% 3.91% 3.95% 4.35% Loan production returned to more historical levels at $492.3 million in 3Q22. 5.55% 9
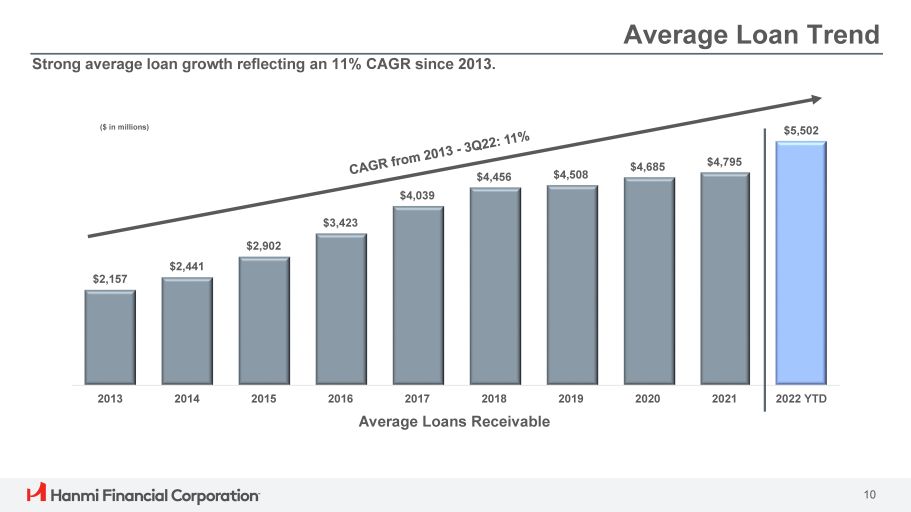
Average Loan Trend $4,039 $3,423 $2,902 $2,441 $2,157 $4,456 $4,508 $4,685 $4,795 $5,502 2013 2014 2015 2016 2019 2020 2021 2022 YTD 2017 2018 Average Loans Receivable Strong average loan growth reflecting an 11% CAGR since 2013. ($ in millions) 10
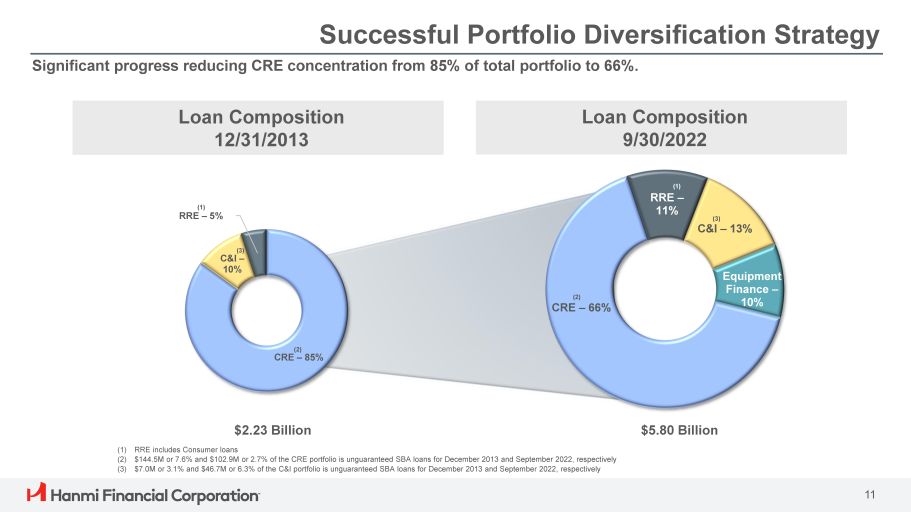
Successful Portfolio Diversification Strategy 11 Loan Composition 9/30/2022 Loan Composition 12/31/2013 $5.80 Billion $2.23 Billion (1) RRE includes Consumer loans (2) $144.5M or 7.6% and $102.9M or 2.7% of the CRE portfolio is unguaranteed SBA loans for December 2013 and September 2022, respectively (3) $7.0M or 3.1% and $46.7M or 6.3% of the C&I portfolio is unguaranteed SBA loans for December 2013 and September 2022, respectively Equipment Finance – 10% (1) RRE – 5% (1) RRE – 11% (2) CRE – 66% (3) C&I – 13% (2) CRE – 85% (3) C&I – 10% Significant progress reducing CRE concentration from 85% of total portfolio to 66%.
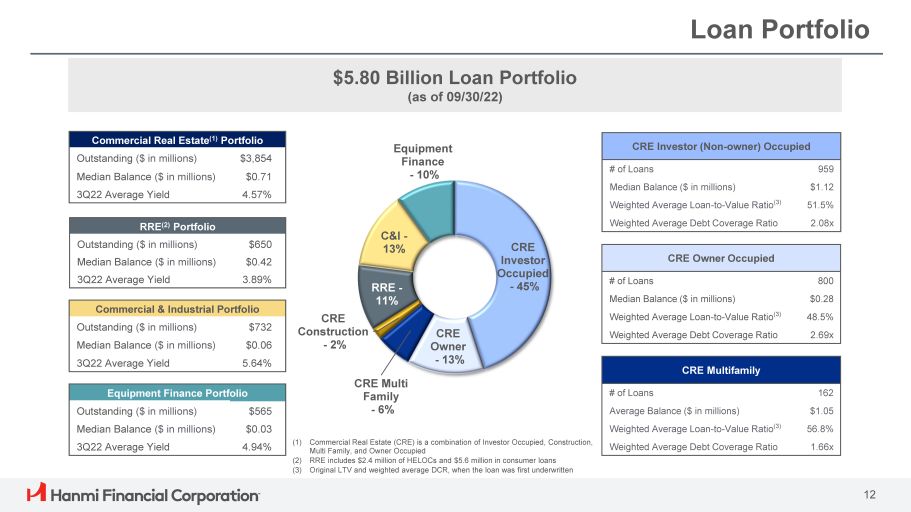
Loan Portfolio Commercial Real Estate (1) Portfolio Outstanding ($ in millions) $3,854 Median Balance ($ in millions) $0.71 3Q22 Average Yield 4.57% $5.80 Billion Loan Portfolio (as of 09/30/22) CRE Investor Occupied - 45% 12 CRE Owner - 13% CRE Multi Family - 6% CRE Construction - 2% RRE - 11% C&I - 13% Equipment Finance - 10% (1) Commercial Real Estate (CRE) is a combination of Investor Occupied, Construction, Multi Family, and Owner Occupied (2) RRE includes $2.4 million of HELOCs and $5.6 million in consumer loans (3) Original LTV and weighted average DCR, when the loan was first underwritten CRE Multifamily # of Loans 162 Average Balance ($ in millions) $1.05 Weighted Average Loan - to - Value Ratio (3) 56.8% Weighted Average Debt Coverage Ratio 1.66x CRE Investor (Non - owner) Occupied # of Loans 959 Median Balance ($ in millions) $1.12 Weighted Average Loan - to - Value Ratio (3) 51.5% Weighted Average Debt Coverage Ratio 2.08x CRE Owner Occupied # of Loans 800 Median Balance ($ in millions) $0.28 Weighted Average Loan - to - Value Ratio (3) 48.5% Weighted Average Debt Coverage Ratio 2.69x RRE (2) Portfolio Outstanding ($ in millions) $650 Median Balance ($ in millions) $0.42 3Q22 Average Yield 3.89% Commercial & Industrial Portfolio Outstanding ($ in millions) $732 Median Balance ($ in millions) $0.06 3Q22 Average Yield 5.64% Equipment Finance Portfolio Outstanding ($ in millions) $565 Median Balance ($ in millions) $0.03 3Q22 Average Yield 4.94%
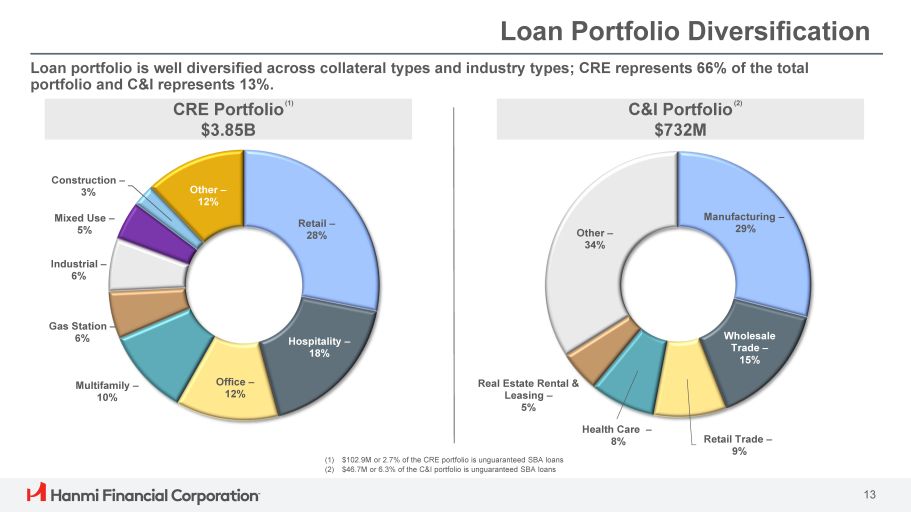
Loan Portfolio Diversification Loan portfolio is well diversified across collateral types and industry types; CRE represents 66% of the total portfolio and C&I represents 13%. CRE Portfolio (1) $3.85B C&I Portfolio (2) $732M Retail – 28% Hospitality – 18% Office – 12% Multifamily – 10% Gas Station – 6% Industrial – 6% Mixed Use – 5% Construction – 3% Other – 12% Manufacturing – 29% 13 Wholesale Trade – 15% Retail Trade – 9% Health Care – 8% Real Estate Rental & Leasing – 5% Other – 34% (1) $102.9M or 2.7% of the CRE portfolio is unguaranteed SBA loans (2) $46.7M or 6.3% of the C&I portfolio is unguaranteed SBA loans
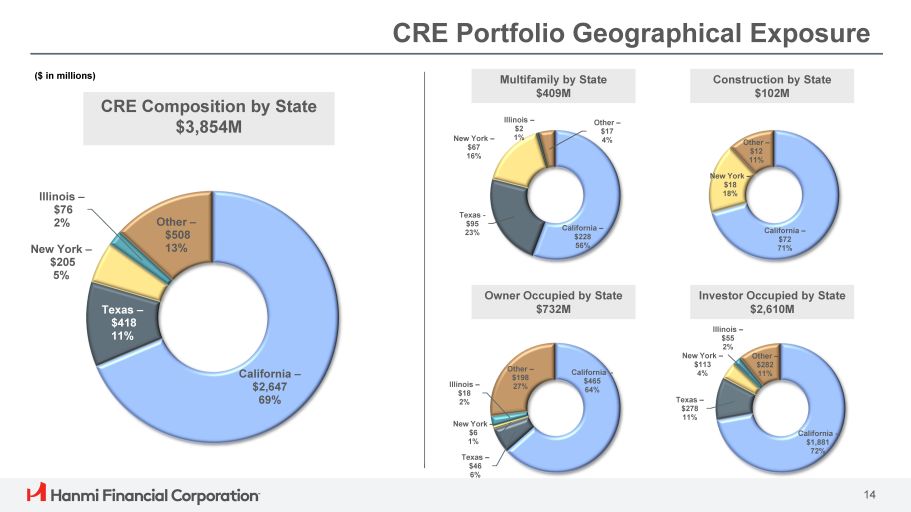
CRE Portfolio Geographical Exposure CRE Composition by State $3,854M Multifamily by State $409M Construction by State $102M Owner Occupied by State $732M Investor Occupied by State $2,610M ($ in millions) California – $2,647 69% Texas – $418 11% New York – $205 5% Illinois – $76 2% Other – $508 13% California – $228 56% Texas - $95 23% New York – $67 16% Illinois – $2 1% Other – $17 4% California – $72 71% New York – $18 18% Other – $12 11% California - $465 64% New York – $6 1% Texas – $46 6% Illinois – $18 2% Other – $198 27% California - $1,881 72% 14 Texas – $278 11% Illinois – $55 2% New York – $113 4% Other – $282 11%
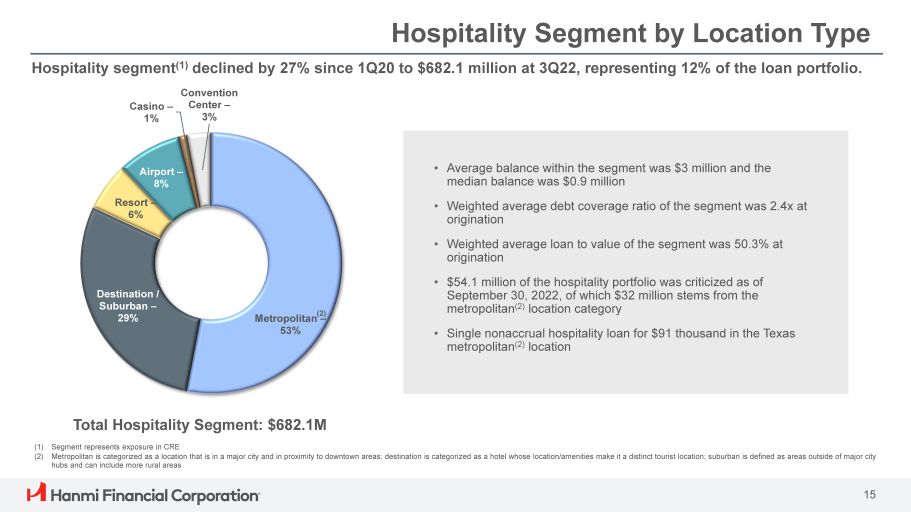
Hospitality Segment by Location Type Total Hospitality Segment: $682.1M (1) Segment represents exposure in CRE (2) Metropolitan is categorized as a location that is in a major city and in proximity to downtown areas; destination is categorized as a hotel whose location/amenities make it a distinct tourist location; suburban is defined as areas outside of major city hubs and can include more rural areas • Average balance within the segment was $3 million and the median balance was $0.9 million • Weighted average debt coverage ratio of the segment was 2.4x at origination • Weighted average loan to value of the segment was 50.3% at origination • $54.1 million of the hospitality portfolio was criticized as of September 30, 2022, of which $32 million stems from the metropolitan (2) location category • Single nonaccrual hospitality loan for $91 thousand in the Texas metropolitan (2) location Metropolitan – 53% 15 Destination / Suburban – 29% Airport – 8% Resort – 6% Casino – 1% Hospitality segment (1) declined by 27% since 1Q20 to $682.1 million at 3Q22, representing 12% of the loan portfolio. Convention Center – 3% (2)
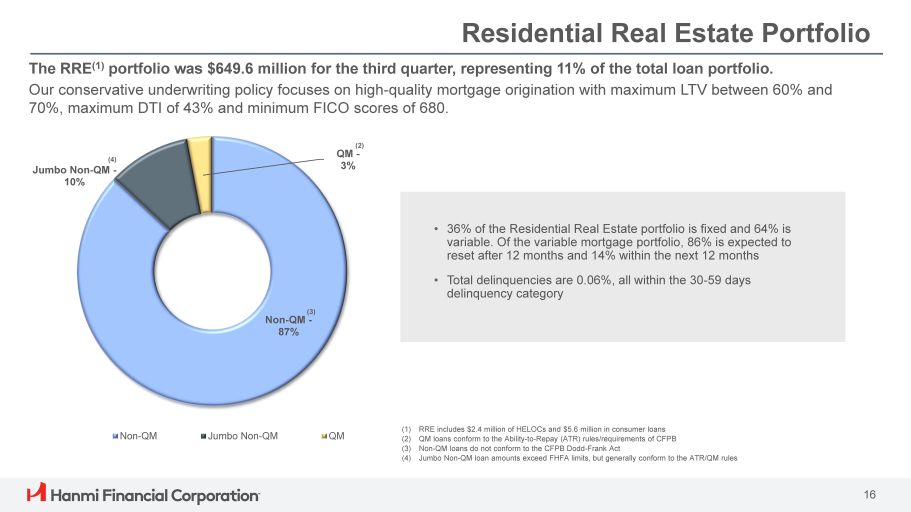
Residential Real Estate Portfolio (2) QM - 3% (3) Non - QM - 87% (4) Jumbo Non - QM - 10% Non - QM Jumbo Non - QM QM 16 The RRE (1) portfolio was $649.6 million for the third quarter, representing 11% of the total loan portfolio. Our conservative underwriting policy focuses on high - quality mortgage origination with maximum LTV between 60% and 70%, maximum DTI of 43% and minimum FICO scores of 680. (1) RRE includes $2.4 million of HELOCs and $5.6 million in consumer loans (2) QM loans conform to the Ability - to - Repay (ATR) rules/requirements of CFPB (3) Non - QM loans do not conform to the CFPB Dodd - Frank Act (4) Jumbo Non - QM loan amounts exceed FHFA limits, but generally conform to the ATR/QM rules • 36 % of the Residential Real Estate portfolio is fixed and 64 % is variable . Of the variable mortgage portfolio, 86 % is expected to reset after 12 months and 14 % within the next 12 months • Total delinquencies are 0.06%, all within the 30 - 59 days delinquency category
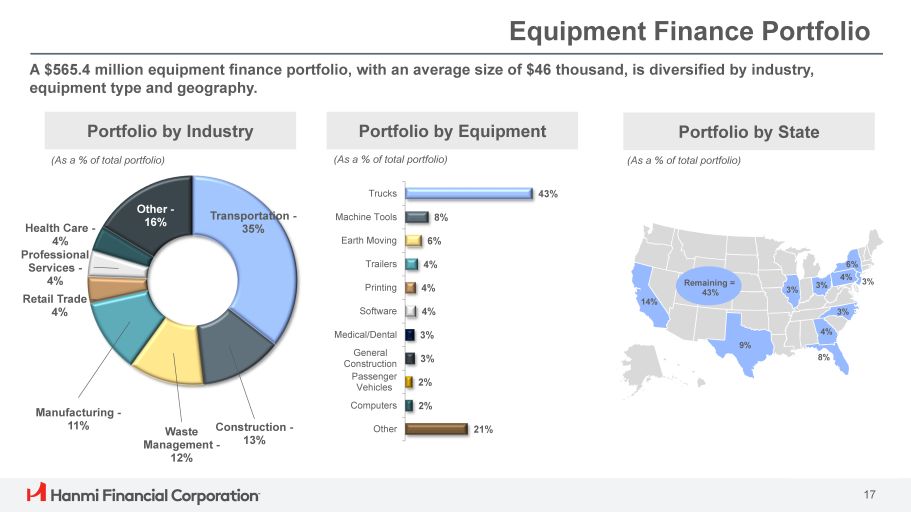
Equipment Finance Portfolio A $565.4 million equipment finance portfolio, with an average size of $46 thousand, is diversified by industry, equipment type and geography. Transportation - 35% Construction - 13% Waste Management - 12% Manufacturing - 11% Health Care - 4% Professional Services - 4% Retail Trade – 4% Other - 16% 43% 8% 6% 4% 4% 4% 3% 3% 2% 2% 21% Trucks Machine Tools Earth Moving Trailers Printing Software Medical/Dental General Construction Passenger Vehicles Computers Other Portfolio by Industry Portfolio by Equipment Portfolio by State (As a % of total portfolio) (As a % of total portfolio) (As a % of total portfolio) 14% 17 9% 4% 8% 6% 4% 3% 3% 3% Remaining = 43% 3%
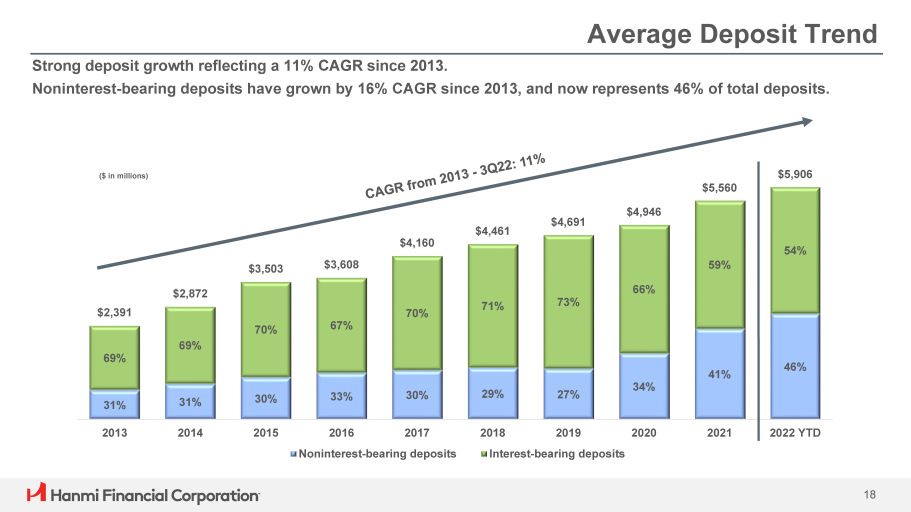
31% 31% 30% 33% 30% 29% 27% 34% 41% 46% 69% 69% 70% 67% 70% 71% 73% 66% 59% 54% $2,391 $2,872 $3,503 $3,608 $4,160 $4,461 $4,691 $5,560 $4,946 $5,906 2013 2014 2015 2020 2021 2022 YTD 2016 2017 Noninterest - bearing deposits 2018 2019 Interest - bearing deposits Average Deposit Trend ($ in millions) Strong deposit growth reflecting a 11% CAGR since 2013. Noninterest - bearing deposits have grown by 16% CAGR since 2013, and now represents 46% of total deposits. 18
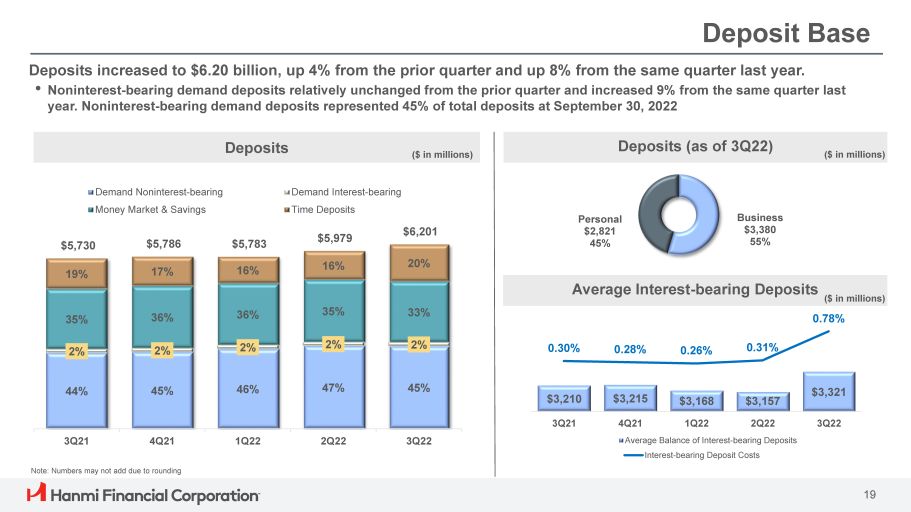
Deposit Base Deposits increased to $6.20 billion, up 4% from the prior quarter and up 8% from the same quarter last year. • Noninterest - bearing demand deposits relatively unchanged from the prior quarter and increased 9% from the same quarter last year. Noninterest - bearing demand deposits represented 45% of total deposits at September 30, 2022 3Q21 4Q21 Note: Numbers may not add due to rounding Deposits ($ in millions) 44% 45% 46% 47% 45% 2% 2% 2% 2% 2% 35% 36% 36% 35% 33% 19% 17% 16% 16% $5,730 $5,786 $5,783 $5,979 1Q22 2Q22 3Q22 Demand Noninterest - bearing Money Market & Savings Demand Interest - bearing Time Deposits Personal Business $6,201 $2,821 $3,380 20% 45% 55% 0.30% 0.28% 0.26% 0.31% 0.78% Average Balance of Interest - bearing Deposits Interest - bearing Deposit Costs Deposits (as of 3Q22) Average Interest - bearing Deposits ($ in millions) $3,210 $3,215 $3,168 $3,157 $3,321 3Q21 4Q21 1Q22 2Q22 3Q22 ($ in millions) 19
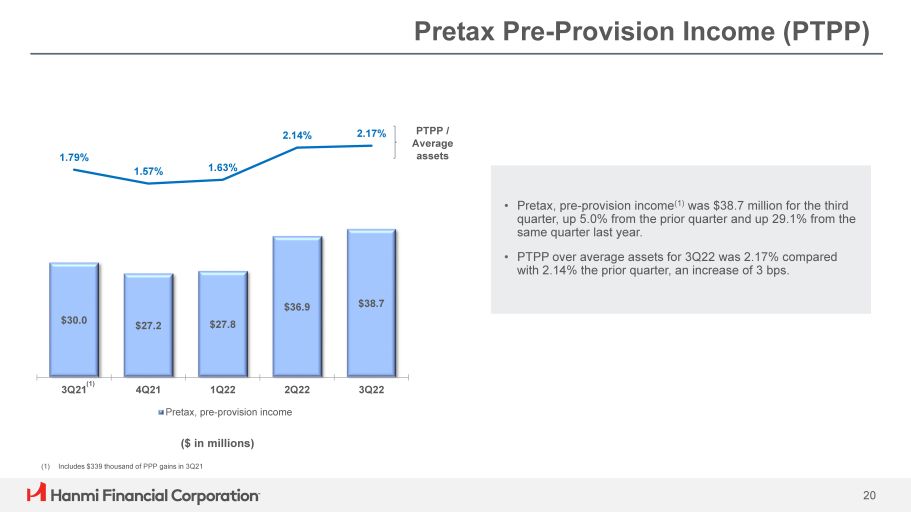
Pretax Pre - Provision Income (PTPP) • Pretax, pre - provision income (1) was $38.7 million for the third quarter, up 5.0% from the prior quarter and up 29.1% from the same quarter last year. • PTPP over average assets for 3Q22 was 2.17% compared with 2.14% the prior quarter, an increase of 3 bps. (1) Includes $339 thousand of PPP gains in 3Q21 $30.0 $27.2 $27.8 $36.9 $38.7 1.79% 1.57% 1.63% 2.14% 2.17% 3Q21 4Q21 1Q22 2Q22 Pretax, pre - provision income 3Q22 PTPP / Average assets 20 ($ in millions) (1)
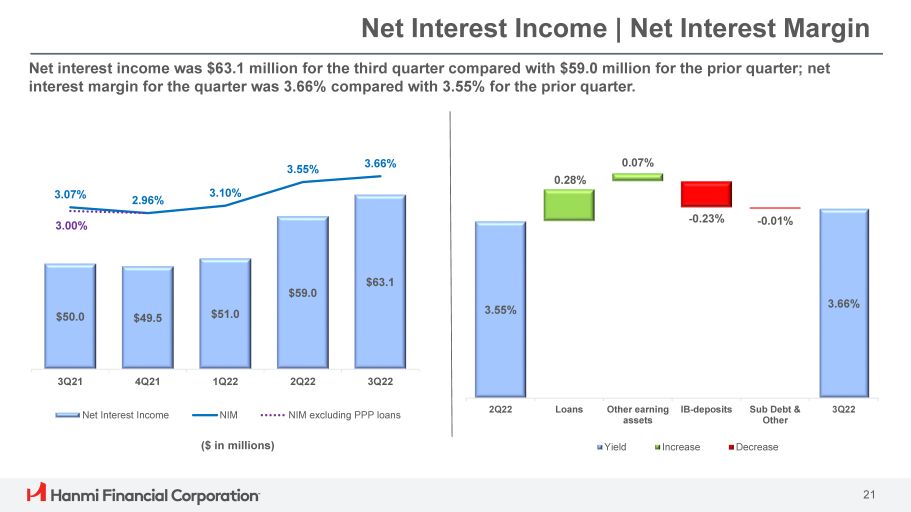
Net Interest Income | Net Interest Margin Net interest income was $63.1 million for the third quarter compared with $59.0 million for the prior quarter; net interest margin for the quarter was 3.66% compared with 3.55% for the prior quarter. $50.0 $49.5 $51.0 $63.1 $59.0 3.07% 2.96% 3.10% 3.55% 3.66% 3.00% 3Q21 4Q21 1Q22 2Q22 3Q22 Net Interest Income NIM NIM excluding PPP loans ($ in millions) 3.55% 3.66% 0.28% 0.07% - 0.23% - 0.01% 2Q22 Loans Other earning assets IB - deposits Sub Debt & Other 3Q22 Yield Increase Decrease 21
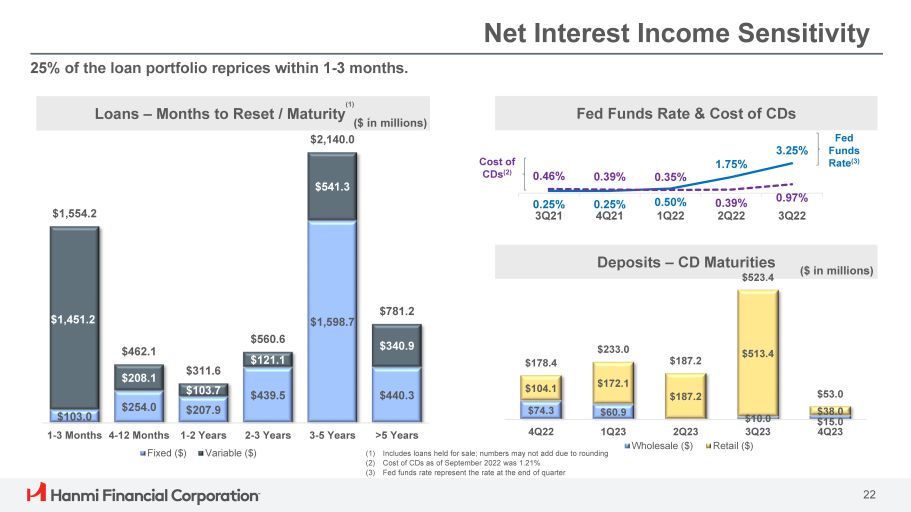
Deposits – CD Maturities $523.4 Net Interest Income Sensitivity 25% of the loan portfolio reprices within 1 - 3 months. $1,598.7 $1,451.2 $541.3 $1,554.2 $2,140.0 $781.2 1 - 3 Months 4 - 12 Months 1 - 2 Years 2 - 3 Years 3 - 5 Years >5 Years Fixed ($) Variable ($) Loans – Months to Reset / Maturity ($ . millions) in Fed Funds Rate & Cost of CDs $462.1 $208.1 $311.6 $103.7 $560.6 $121.1 $439.5 $340.9 $440.3 $178.4 $104.1 $233.0 $172.1 $187.2 $187.2 $513.4 $53.0 $103.0 $254.0 $207.9 $74.3 $60.9 $10.0 $38.0 $15.0 4Q22 1Q23 4Q23 2Q23 Wholesale ($) 3Q23 Retail ($) ($ in millions) 1.75% 3.25% 0.46% 0.39% 0.35% 0.25% 3Q21 0.25% 4Q21 0.50% 1Q22 0.39% 2Q22 0.97% 3Q22 Fed Funds Rate (3) Cost of CDs (2) 22 (1) Includes loans held for sale; numbers may not add due to rounding (2) Cost of CDs as of September 2022 was 1.21% (3) Fed funds rate represent the rate at the end of quarter (1)
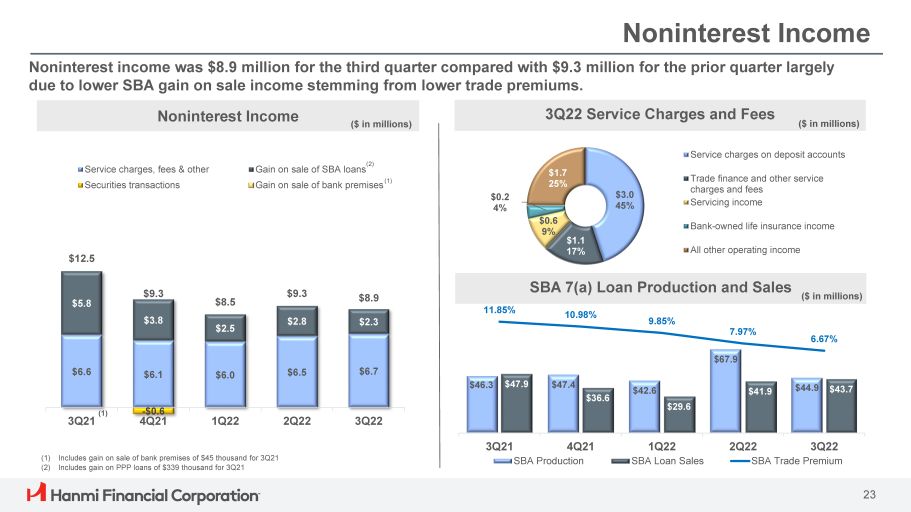
$3.0 45% $1.1 17% $0.6 9% $0.2 4% $1.7 25% Service charges on deposit accounts Trade finance and other service charges and fees Servicing income Bank - owned life insurance income All other operating income Noninterest Income ($ in millions) Service Charges and Fees (as of 1Q22) ($ in millions) SBA 7(a) Loan Production and Sales ($ in millions) $46.3 $47.4 $42.6 $67.9 $44.9 $47.9 $36.6 $29.6 $41.9 $43.7 11.85% 10.98% 9.85% 7.97% 6.67% 3Q21 4Q21 1Q22 SBA Loan Sales SBA Production 2Q22 3Q22 SBA Trade Premium Noninterest income was $8.9 million for the third quarter compared with $9.3 million for the prior quarter largely due to lower SBA gain on sale income stemming from lower trade premiums. (1) Includes gain on sale of bank premises of $45 thousand for 3Q21 (2) Includes gain on PPP loans of $339 thousand for 3Q21 (2) $6.6 $6.1 $6.0 $6.5 $6.7 $5.8 $3.8 $2.5 $2.8 $2.3 $12.5 $9.3 $8.5 $9.3 $8.9 3Q21 - $0.6 4Q21 1Q22 2Q22 3Q22 Service charges, fees & other Securities transactions Gain on sale of SBA loans Gain on sale of bank premises (1) Total noninterest income Noninterest Income 3Q22 Service Charges and Fees 23 (1) ($ in millions) ($ in millions)
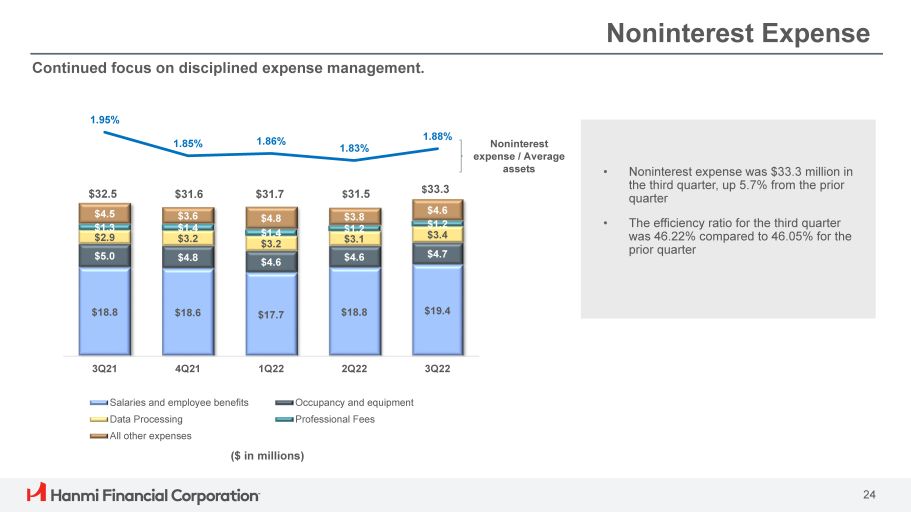
Noninterest Expense • Noninterest expense was $33.3 million in the third quarter, up 5.7% from the prior quarter • The efficiency ratio for the third quarter was 46.22% compared to 46.05% for the prior quarter Continued focus on disciplined expense management. ($ in millions) Noninterest expense / Average assets $18.8 $18.6 $17.7 $18.8 $19.4 $4.8 $1.4 $3.2 $4.6 $ 31.5 $3.8 $1.2 $3.1 $4.6 $32.5 $4.5 $1.3 $2.9 $5.0 $31.6 $3.6 $1.4 $3.2 $4.8 1.95% 1.85% 1.86% 1.83% 1.88% 1Q22 2Q22 3Q22 Occupancy and equipment Professional Fees 3Q21 4Q21 Salaries and employee benefits Data Processing All other expenses Noninterest expense/Average assets $31.7 24 $ 33.3 $4.6 $1.2 $3.4 $4.7
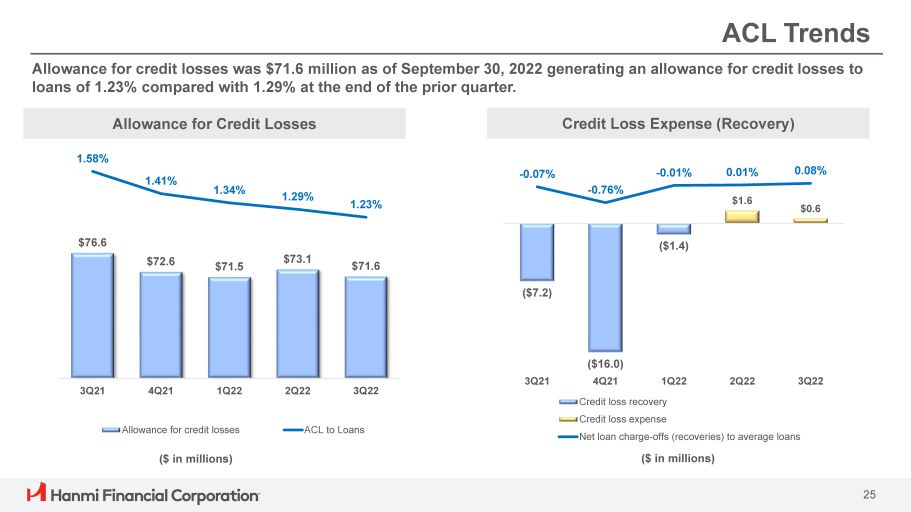
ACL Trends Allowance for credit losses was $71.6 million as of September 30, 2022 generating an allowance for credit losses to loans of 1.23% compared with 1.29% at the end of the prior quarter. ($ in millions) $76.6 $72.6 $71.5 $73.1 $71.6 1.58% 1.41% 1.34% 1.29% 1.23% 3Q21 4Q21 1Q22 2Q22 3Q22 Allowance for credit losses ACL to Loans ($7.2) ($1.4) $1.6 $0.6 - 0.07% - 0.76% ($16.0) 4Q21 1Q22 2Q22 3Q22 Credit loss recovery Credit loss expense Net loan charge - offs (recoveries) to average loans ($ in millions) - 0.01% 0.01% 0.08% 3Q21 Allowance for Credit Losses 25 Credit Loss Expense (Recovery)
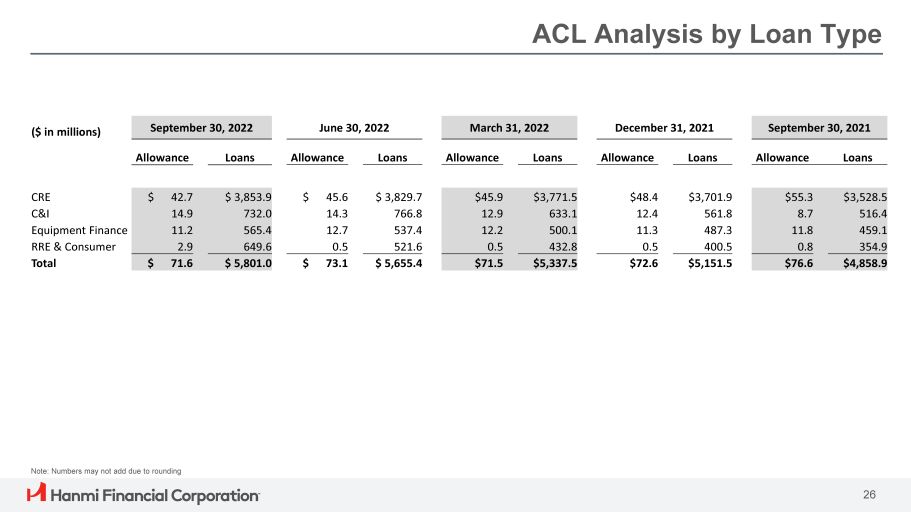
ACL Analysis by Loan Type ($ in millions) September 30, 2022 June 30, 2022 March 31, 2022 December 31, 2021 September 30, 2021 Allowance Loans Allowance Loans Allowance Loans Allowance Loans Allowance Loans CRE $ 42.7 $ 3,853.9 $ 45.6 $ 3,829.7 $45.9 $3,771.5 $48.4 $3,701.9 $55.3 $3,528.5 C&I 14.9 732.0 14.3 766.8 12.9 633.1 12.4 561.8 8.7 516.4 Equipment Finance 11.2 565.4 12.7 537.4 12.2 500.1 11.3 487.3 11.8 459.1 RRE & Consumer 2.9 649.6 0.5 521.6 0.5 432.8 0.5 400.5 0.8 354.9 Total $ 71.6 $ 5,801.0 $ 73.1 $ 5,655.4 $71.5 $5,337.5 $72.6 $5,151.5 $76.6 $4,858.9 Note: Numbers may not add due to rounding 26
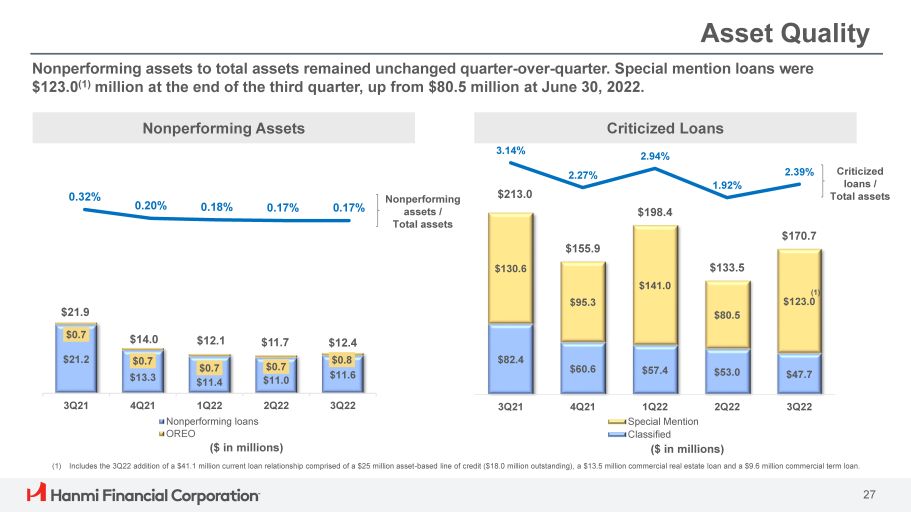
$0.7 $21.9 $14.0 $12.1 $11.7 $12.4 Asset Quality ($ in millions) 0.32% 0.20% 0.18% 0.17% 0.17% Nonperforming assets / Total assets $130.6 $95.3 $141.0 $80.5 $213.0 $155.9 $198.4 $133.5 $170.7 $21.2 $0.7 $0.7 $13.3 $11.4 $0.7 $11.0 $0.8 $11.6 $82.4 $60.6 $57.4 $53.0 $47.7 3Q21 4Q21 1Q22 2Q22 3Q22 3Q21 4Q21 1Q22 2Q22 3Q22 Nonperforming loans OREO Special Mention Classified 3.14% 2.27% 2.94% 1.92% 2.39% (1) $123.0 ($ in millions) Nonperforming Assets Criticized Loans Criticized loans / Total assets Nonperforming assets to total assets remained unchanged quarter - over - quarter. Special mention loans were $123.0 (1) million at the end of the third quarter, up from $80.5 million at June 30, 2022. 27 (1) Includes the 3Q22 addition of a $41.1 million current loan relationship comprised of a $25 million asset - based line of credit ($18.0 million outstanding), a $13.5 million commercial real estate loan and a $9.6 million commercial term loan.
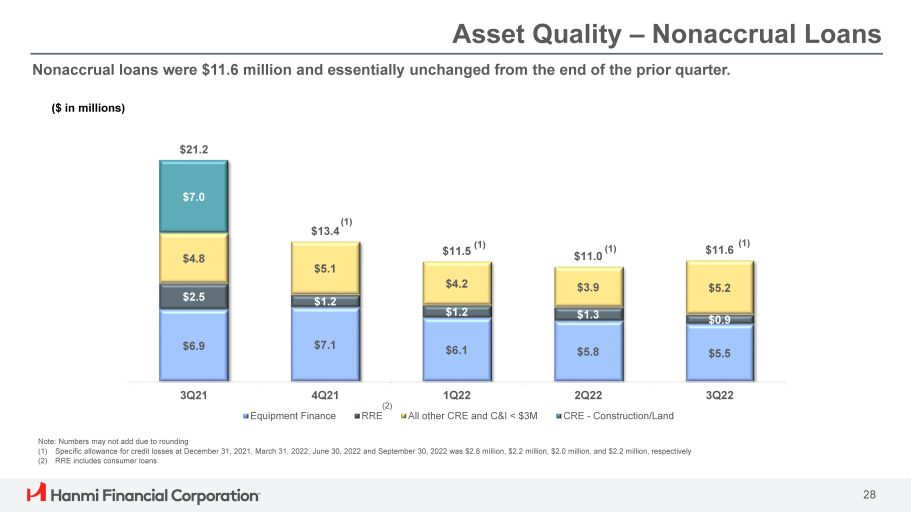
Asset Quality – Nonaccrual Loans Note: Numbers may not add due to rounding (1) Specific allowance for credit losses at December 31, 2021, March 31, 2022, June 30, 2022 and September 30, 2022 was $2.8 million, $2.2 million, $2.0 million, and $2.2 million, respectively (2) RRE includes consumer loans $6.9 $7.1 $6.1 $5.8 $5.5 $2.5 $1.2 $1.2 $1.3 $0.9 $4.8 $5.1 $4.2 $3.9 $5.2 $11.0 Nonaccrual loans were $11.6 million and essentially unchanged from the end of the prior quarter. ($ in millions) $21.2 $7.0 (1) $13.4 $11.6 (1) 3Q21 4Q21 Equipment Finance 1Q22 All other CRE and C&I < $3M 2Q22 CRE - Construction/Land 3Q22 (2) RRE (1) 28 $11.5 (1)
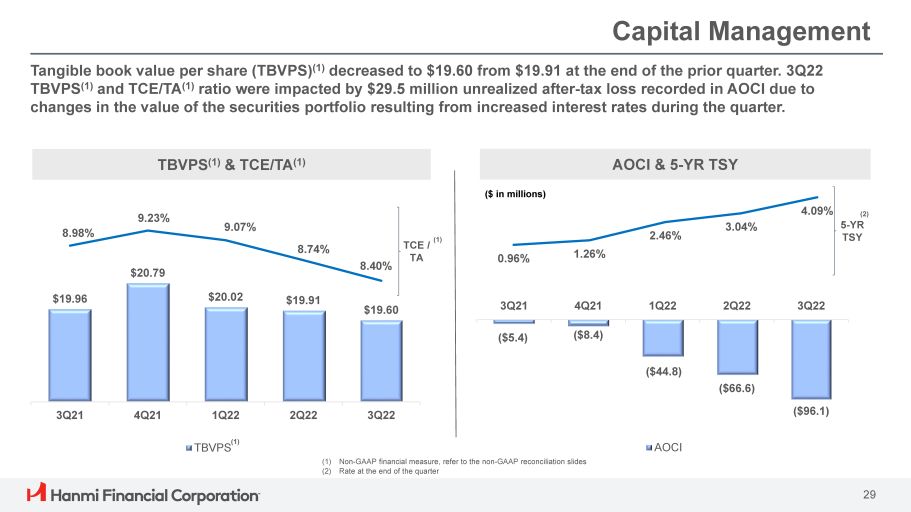
(1) Non - GAAP financial measure, refer to the non - GAAP reconciliation slides (2) Rate at the end of the quarter Capital Management Tangible book value per share (TBVPS) (1) decreased to $19.60 from $19.91 at the end of the prior quarter. 3Q22 TBVPS (1) and TCE/TA (1) ratio were impacted by $29.5 million unrealized after - tax loss recorded in AOCI due to changes in the value of the securities portfolio resulting from increased interest rates during the quarter. 0.96% 1.26% 2.46% 3.04% 4.09% ($5.4) ($8.4) ($44.8) ($66.6) ($96.1) 3Q21 4Q21 1Q22 2Q22 3Q22 AOCI $19.96 $20.79 $20.02 $19.91 $19.60 8.98% 9.23% 9.07% 8.74% 8.40% 3Q21 4Q21 1Q22 2Q22 3Q22 (1) TBVPS TBVPS (1) & TCE/TA (1) AOCI & 5 - YR TSY (2) 5 - YR TSY TCE / (1) TA ($ in millions) 29
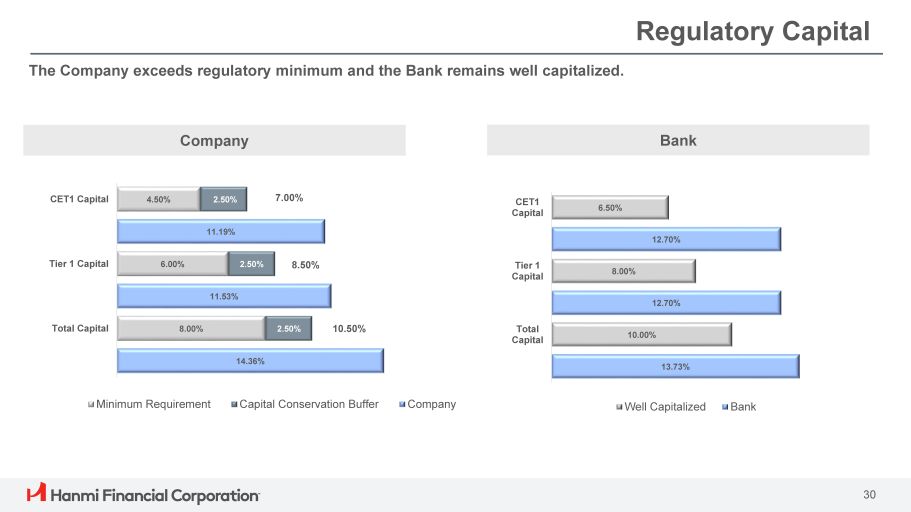
Regulatory Capital The Company exceeds regulatory minimum and the Bank remains well capitalized. 8.00% 6.00% 4.50% 2.50% 2.50% 2.50% 14.36% 11.53% 11.19% 10.50% 8.50% 7.00% Total Capital Tier 1 Capital CET1 Capital Minimum Requirement Capital Conservation Buffer Company 10.00% 8.00% 6.50% 13.73% 12.70% 12.70% Total Capital Tier 1 Capital CET1 Capital Well Capitalized Bank 30 Company Bank
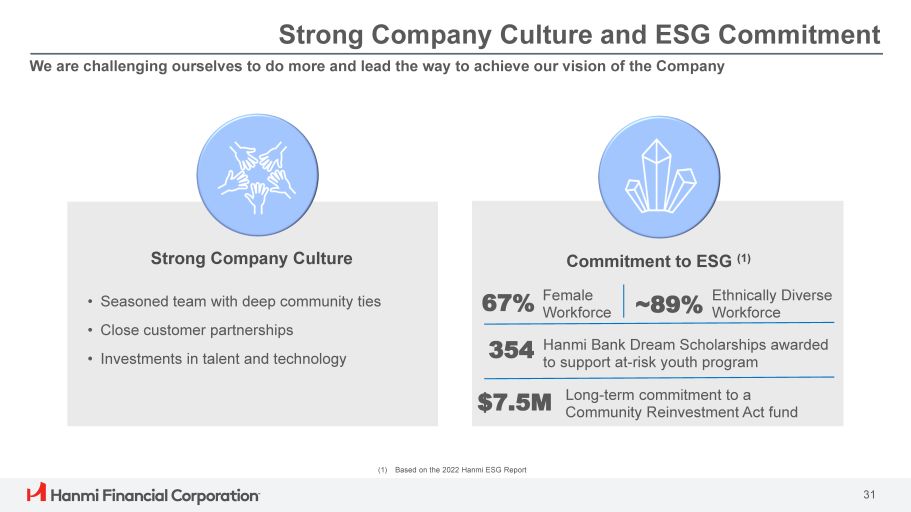
Strong Company Culture and ESG Commitment We are challenging ourselves to do more and lead the way to achieve our vision of the Company • Seasoned team with deep community ties • Close customer partnerships • Investments in talent and technology Strong Company Culture Commitment to ESG (1) 67% Female ~89% Ethnically Diverse Workforce Workforce to support at - risk youth program $7.5M 354 Hanmi Bank Dream Scholarships awarded 31 Long - term commitment to a Community Reinvestment Act fund (1) Based on the 2022 Hanmi ESG Report
Appendix 32
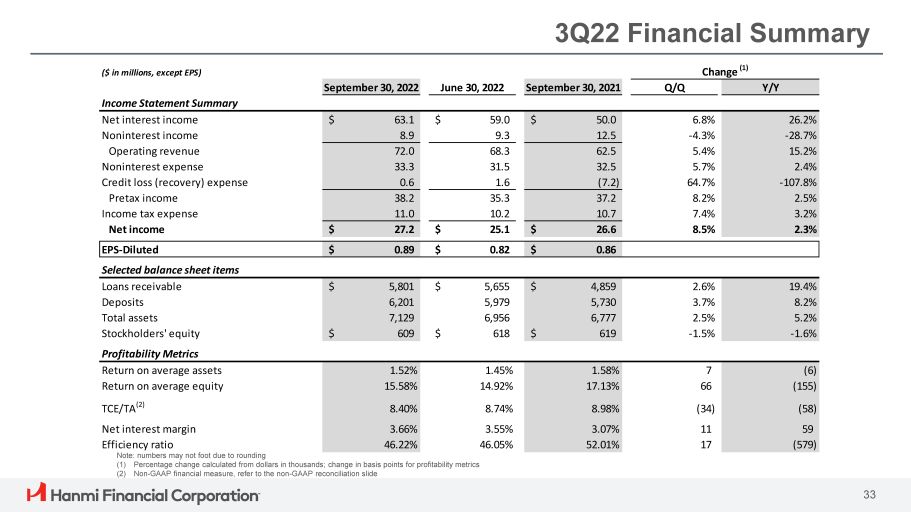
3Q22 Financial Summary Profitability Metrics Return on average assets Return on average equity TCE/TA (2) Net interest margin Efficiency ratio Note: numbers may not foot due to rounding (1) Percentage change calculated from dollars in thousands; change in basis points for profitability metrics (2) Non - GAAP financial measure, refer to the non - GAAP reconciliation slide EPS - Diluted $ 0.89 $ 0.82 $ 0.86 1.52% 1.45% 1.58% 7 (6) 15.58% 14.92% 17.13% 66 (155) 8.40% 8.74% 8.98% (34) (58) 3.66% 3.55% 3.07% 11 59 46.22% 46.05% 52.01% 17 (579) ($ in millions, except EPS) Change (1) September 30, 2022 June 30, 2022 September 30, 2021 Q/Q Y/Y Income Statement Summary Net interest income $ 63.1 $ 59.0 $ 50.0 6.8% 26.2% Noninterest income 8.9 9.3 12.5 - 4.3% - 28.7% Operating revenue 72.0 68.3 62.5 5.4% 15.2% Noninterest expense 33.3 31.5 32.5 5.7% 2.4% Credit loss (recovery) expense 0.6 1.6 (7.2) 64.7% - 107.8% Pretax income 38.2 35.3 37.2 8.2% 2.5% Income tax expense 11.0 10.2 10.7 7.4% 3.2% Net income $ 27.2 $ 25.1 $ 26.6 8.5% 2.3% Selected balance sheet items Loans receivable $ 5,801 $ 5,655 $ 4,859 2.6% 19.4% Deposits 6,201 5,979 5,730 3.7% 8.2% Total assets 7,129 6,956 6,777 2.5% 5.2% Stockholders' equity $ 609 $ 618 $ 619 - 1.5% - 1.6% 33
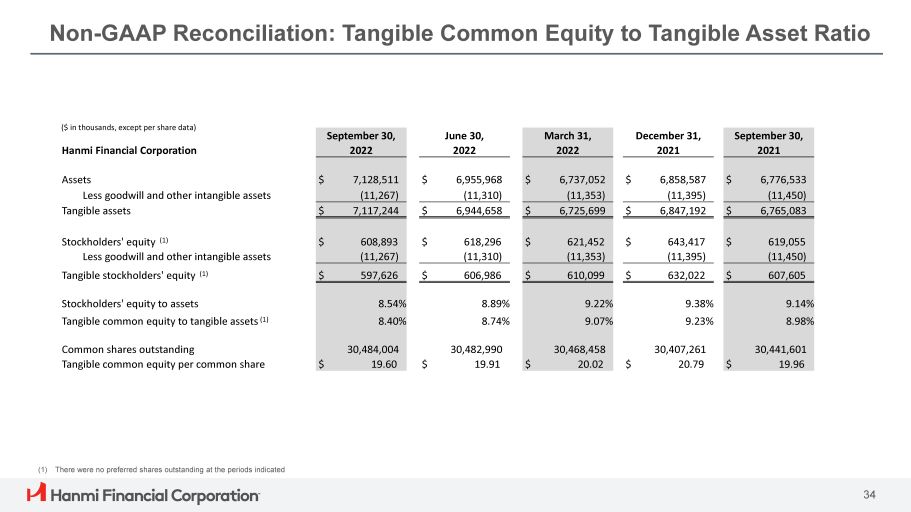
Non - GAAP Reconciliation: Tangible Common Equity to Tangible Asset Ratio 34 (1) There were no preferred shares outstanding at the periods indicated September 30, June 30, March 31, December 31, September 30, Hanmi Financial Corporation 2022 2022 2022 2021 2021 Assets $ 7,128,511 $ 6,955,968 $ 6,737,052 $ 6,858,587 $ 6,776,533 Less goodwill and other intangible assets (11,267) (11,310) (11,353) (11,395) (11,450) Tangible assets $ 7,117,244 $ 6,944,658 $ 6,725,699 $ 6,847,192 $ 6,765,083 Stockholders' equity (1) $ 608,893 $ 618,296 $ 621,452 $ 643,417 $ 619,055 Less goodwill and other intangible assets (11,267) (11,310) (11,353) (11,395) (11,450) Tangible stockholders' equity (1) $ 597,626 $ 606,986 $ 610,099 $ 632,022 $ 607,605 Stockholders' equity to assets 8.54% 8.89% 9.22% 9.38% 9.14% Tangible common equity to tangible assets (1) 8.40% 8.74% 9.07% 9.23% 8.98% Common shares outstanding 30,484,004 30,482,990 30,468,458 30,407,261 30,441,601 Tangible common equity per common share $ 19.60 $ 19.91 $ 20.02 $ 20.79 $ 19.96 ($ in thousands, except per share data)
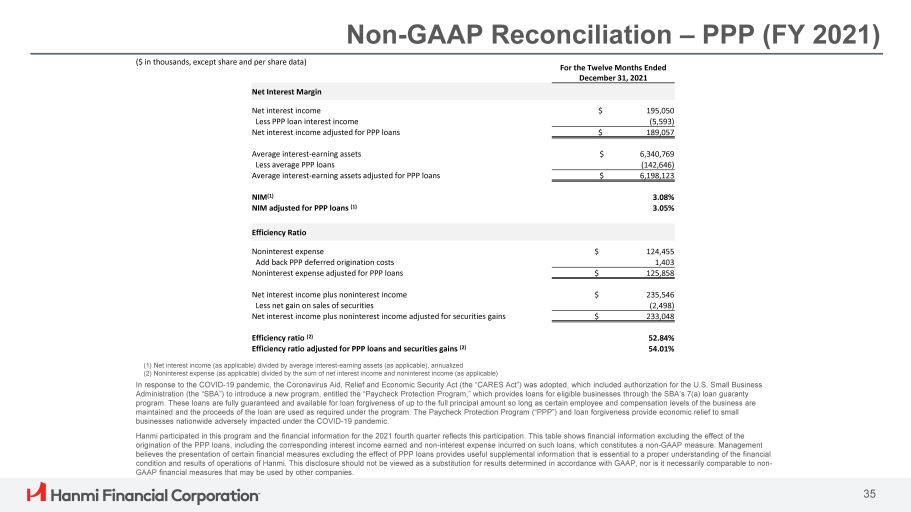
Non - GAAP Reconciliation – PPP (FY 2021) (1) Net interest income (as applicable) divided by average interest - earning assets (as applicable), annualized (2) Noninterest expense (as applicable) divided by the sum of net interest income and noninterest income (as applicable) In response to the COVID - 19 pandemic, the Coronavirus Aid, Relief and Economic Security Act (the “CARES Act”) was adopted, which included authorization for the U.S. Small Business Administration (the “SBA”) to introduce a new program, entitled the “Paycheck Protection Program,” which provides loans for eligible businesses through the SBA’s 7(a) loan guaranty program. These loans are fully guaranteed and available for loan forgiveness of up to the full principal amount so long as certain employee and compensation levels of the business are maintained and the proceeds of the loan are used as required under the program. The Paycheck Protection Program (“PPP”) and loan forgiveness provide economic relief to small businesses nationwide adversely impacted under the COVID - 19 pandemic. Hanmi participated in this program and the financial information for the 2021 fourth quarter reflects this participation. This table shows financial information excluding the effect of the origination of the PPP loans, including the corresponding interest income earned and non - interest expense incurred on such loans, which constitutes a non - GAAP measure. Management believes the presentation of certain financial measures excluding the effect of PPP loans provides useful supplemental information that is essential to a proper understanding of the financial condition and results of operations of Hanmi. This disclosure should not be viewed as a substitution for results determined in accordance with GAAP, nor is it necessarily comparable to non - GAAP financial measures that may be used by other companies. ($ in thousands, except share and per share data) For the Twelve Months Ended December 31, 2021 Net Interest Margin Net interest income $ 195,050 Less PPP loan interest income (5,593) Net interest income adjusted for PPP loans $ 189,057 Average interest - earning assets $ 6,340,769 Less average PPP loans (142,646) Average interest - earning assets adjusted for PPP loans $ 6,198,123 NIM (1) 3.08% NIM adjusted for PPP loans (1) 3.05% Efficiency Ratio Noninterest expense $ 124,455 Add back PPP deferred origination costs 1,403 Noninterest expense adjusted for PPP loans $ 125,858 Net interest income plus noninterest income $ 235,546 Less net gain on sales of securities (2,498) Net interest income plus noninterest income adjusted for securities gains $ 233,048 Efficiency ratio (2) 52.84% Efficiency ratio adjusted for PPP loans and securities gains (2) 54.01% 35
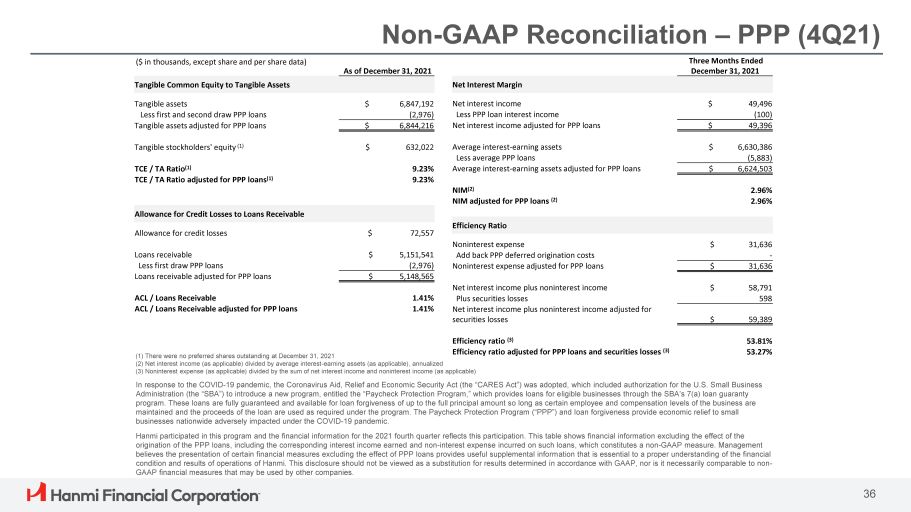
Non - GAAP Reconciliation – PPP (4Q21) As of December 31, 2021 Tangible Common Equity to Tangible Assets Tangible assets $ 6,847,192 Less first and second draw PPP loans (2,976) Tangible assets adjusted for PPP loans $ 6,844,216 Tangible stockholders' equity (1) $ 632,022 TCE / TA Ratio (1) 9.23% TCE / TA Ratio adjusted for PPP loans (1) 9.23% Allowance for Credit Losses to Loans Receivable Allowance for credit losses $ 72,557 Loans receivable $ 5,151,541 Less first draw PPP loans (2,976) Loans receivable adjusted for PPP loans $ 5,148,565 ACL / Loans Receivable 1.41% ACL / Loans Receivable adjusted for PPP loans 1.41% Three Months Ended December 31, 2021 (3) Noninterest expense (as applicable) divided by the sum of net interest income and noninterest income (as applicable) In response to the COVID - 19 pandemic, the Coronavirus Aid, Relief and Economic Security Act (the “CARES Act”) was adopted, which included authorization for the U.S. Small Business Administration (the “SBA”) to introduce a new program, entitled the “Paycheck Protection Program,” which provides loans for eligible businesses through the SBA’s 7(a) loan guaranty program. These loans are fully guaranteed and available for loan forgiveness of up to the full principal amount so long as certain employee and compensation levels of the business are maintained and the proceeds of the loan are used as required under the program. The Paycheck Protection Program (“PPP”) and loan forgiveness provide economic relief to small businesses nationwide adversely impacted under the COVID - 19 pandemic. Hanmi participated in this program and the financial information for the 2021 fourth quarter reflects this participation. This table shows financial information excluding the effect of the origination of the PPP loans, including the corresponding interest income earned and non - interest expense incurred on such loans, which constitutes a non - GAAP measure. Management believes the presentation of certain financial measures excluding the effect of PPP loans provides useful supplemental information that is essential to a proper understanding of the financial condition and results of operations of Hanmi. This disclosure should not be viewed as a substitution for results determined in accordance with GAAP, nor is it necessarily comparable to non - GAAP financial measures that may be used by other companies. 36 Net Interest Margin Net interest income Less PPP loan interest income Net interest income adjusted for PPP loans $ 49,496 (100) $ 49,396 Average interest - earning assets Less average PPP loans Average interest - earning assets adjusted for PPP loans $ 6,630,386 (5,883) $ 6,624,503 NIM (2) NIM adjusted for PPP loans (2) 2.96% 2.96% Efficiency Ratio Noninterest expense Add back PPP deferred origination costs Noninterest expense adjusted for PPP loans $ 31,636 - $ 31,636 $ 58,791 598 Net interest income plus noninterest income Plus securities losses Net interest income plus noninterest income adjusted for securities losses $ 59,389 Efficiency ratio (3) 53.81% Efficiency ratio adjusted for PPP loans and securities losses (3) 53.27% ($ in thousands, except share and per share data) (1) There were no preferred shares outstanding at December 31, 2021 (2) Net interest income (as applicable) divided by average interest - earning assets (as applicable), annualized
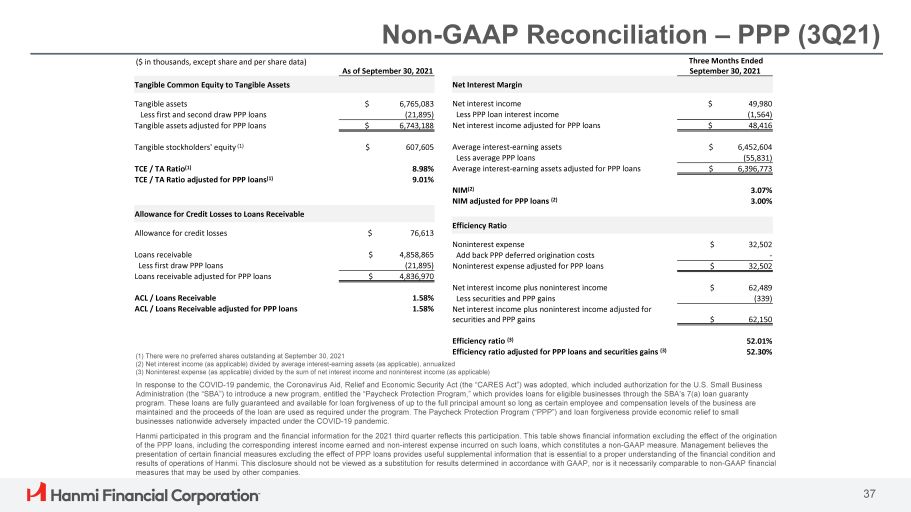
Non - GAAP Reconciliation – PPP (3Q21) As of September 30, 2021 Tangible Common Equity to Tangible Assets Tangible assets $ 6,765,083 Less first and second draw PPP loans (21,895) Tangible assets adjusted for PPP loans $ 6,743,188 Tangible stockholders' equity (1) $ 607,605 TCE / TA Ratio (1) 8.98% TCE / TA Ratio adjusted for PPP loans (1) 9.01% Allowance for Credit Losses to Loans Receivable Allowance for credit losses $ 76,613 Loans receivable $ 4,858,865 Less first draw PPP loans (21,895) Loans receivable adjusted for PPP loans $ 4,836,970 ACL / Loans Receivable 1.58% ACL / Loans Receivable adjusted for PPP loans 1.58% Three Months Ended September 30, 2021 measures that may be used by other companies. 37 Net Interest Margin Net interest income Less PPP loan interest income Net interest income adjusted for PPP loans $ 49,980 (1,564) $ 48,416 Average interest - earning assets Less average PPP loans Average interest - earning assets adjusted for PPP loans $ 6,452,604 (55,831) $ 6,396,773 NIM (2) NIM adjusted for PPP loans (2) 3.07% 3.00% Efficiency Ratio Noninterest expense Add back PPP deferred origination costs Noninterest expense adjusted for PPP loans $ 32,502 - $ 32,502 $ 62,489 (339) Net interest income plus noninterest income Less securities and PPP gains Net interest income plus noninterest income adjusted for securities and PPP gains $ 62,150 Efficiency ratio (3) Efficiency ratio adjusted for PPP loans and securities gains (3) 52.01% 52.30% ($ in thousands, except share and per share data) (1) There were no preferred shares outstanding at September 30, 2021 (2) Net interest income (as applicable) divided by average interest - earning assets (as applicable), annualized (3) Noninterest expense (as applicable) divided by the sum of net interest income and noninterest income (as applicable) In response to the COVID - 19 pandemic, the Coronavirus Aid, Relief and Economic Security Act (the “CARES Act”) was adopted, which included authorization for the U.S. Small Business Administration (the “SBA”) to introduce a new program, entitled the “Paycheck Protection Program,” which provides loans for eligible businesses through the SBA’s 7(a) loan guaranty program. These loans are fully guaranteed and available for loan forgiveness of up to the full principal amount so long as certain employee and compensation levels of the business are maintained and the proceeds of the loan are used as required under the program. The Paycheck Protection Program (“PPP”) and loan forgiveness provide economic relief to small businesses nationwide adversely impacted under the COVID - 19 pandemic. Hanmi participated in this program and the financial information for the 2021 third quarter reflects this participation. This table shows financial information excluding the effect of the origination of the PPP loans, including the corresponding interest income earned and non - interest expense incurred on such loans, which constitutes a non - GAAP measure. Management believes the presentation of certain financial measures excluding the effect of PPP loans provides useful supplemental information that is essential to a proper understanding of the financial condition and results of operations of Hanmi. This disclosure should not be viewed as a substitution for results determined in accordance with GAAP, nor is it necessarily comparable to non - GAAP financial