Exhibit 99.2
1Q24 Earnings Supplemental Presentation April 23, 2024 Los Angeles New York/ New Jersey Virginia Chicago Dallas Houston San Francisco San Diego
Hanmi Financial Corporation (the “Company”) cautions investors that any statements contained herein that are not historical facts are forward - looking statements within the meaning of the “safe harbor” provisions of the Private Securities Litigation Reform Act of 1995 , including, but not limited to, those statements regarding operating and financial performance, financial position and liquidity, business strategies, regulatory, economic and competitive outlook, investment and expenditure plans, capital and financing needs and availability, litigation, plans and objectives, merger or sale activity, financial condition and results of operations, and all other forecasts and statements of expectation or assumption underlying any of the foregoing . These statements involve known and unknown risks and uncertainties that are difficult to predict . Investors should not rely on any forward - looking statement and should consider risks, such as changes in governmental policy, legislation and regulations, economic uncertainty and changes in economic conditions, inflation, the continuing impact of the COVID - 19 pandemic on our business and results of operations, fluctuations in interest rate and credit risk, competitive pressures, the ability to succeed in new markets, balance sheet management, liquidity and sources of funding, the size and composition of our deposit portfolio, including the percentage of uninsured deposits in the portfolio, increased assessments by the Federal Deposit Insurance Corporation, risk of natural disasters, a failure in or breach of our operational or security systems or infrastructure, including cyberattacks, the adequacy of and changes in the methodology of calculating our allowance for credit losses, and other operational factors . Forward - looking statements are based upon the good faith beliefs and expectations of management as of this date only and are further subject to additional risks and uncertainties, including, but not limited to, the risk factors set forth in our earnings release dated January 23 , 2024 , including the section titled “Forward Looking Statements” and the Company’s most recent Form 10 - K, 10 - Q and other filings with the Securities and Exchange Commission (“SEC”) . The Company disclaims any obligation to update or revise the forward - looking statements herein . 2 Forward - Looking Statements
This presentation contains financial information determined by methods other than in accordance with accounting principles generally accepted in the United States of America (“GAAP”) . These non - GAAP measures include tangible common equity to tangible assets, and tangible common equity per share . Management uses these “non - GAAP” measures in its analysis of the Company’s performance . Management believes these non - GAAP financial measures allow for better comparability of period to period operating performance . Additionally, the Company believes this information is utilized by regulators and market analysts to evaluate a company’s financial condition and therefore, such information is useful to investors . These disclosures should not be viewed as a substitute for operating results determined in accordance with GAAP, nor are they necessarily comparable to non - GAAP performance measures that may be presented by other companies . A reconciliation of the non - GAAP measures used in this presentation to the most directly comparable GAAP measures is provided in the Appendix to this presentation . 3 Non - GAAP Financial Information
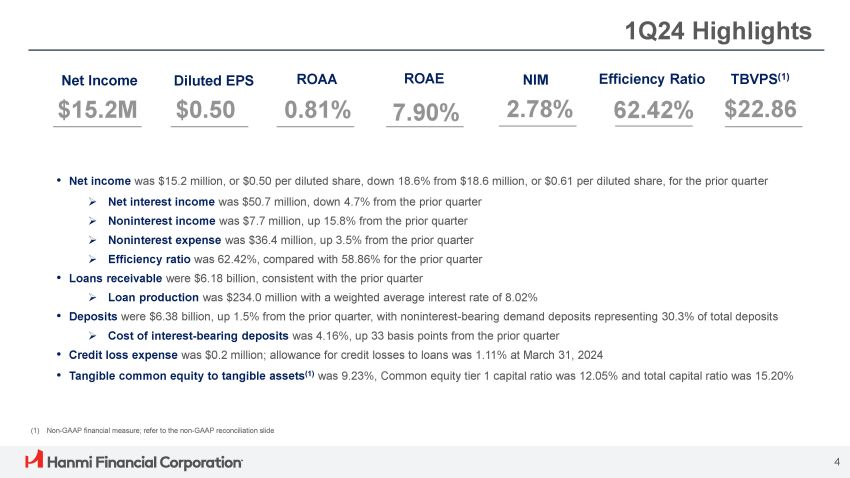
1Q24 Highlights Diluted EPS $0.50 ROAA 0.81% NIM 2.78% Efficiency Ratio 62.42% TBVPS (1) $22.86 Net Income $15.2M • Net income was $15.2 million, or $0.50 per diluted share, down 18.6% from $18.6 million, or $0.61 per diluted share, for the prior quarter » Net interest income was $50.7 million, down 4.7% from the prior quarter » Noninterest income was $7.7 million, up 15.8% from the prior quarter » Noninterest expense was $36.4 million, up 3.5% from the prior quarter » Efficiency ratio was 62.42%, compared with 58.86% for the prior quarter • Loans receivable were $6.18 billion, consistent with the prior quarter » Loan production was $234.0 million with a weighted average interest rate of 8.02% • Deposits were $6.38 billion, up 1.5% from the prior quarter, with noninterest - bearing demand deposits representing 30.3% of total deposits » Cost of interest - bearing deposits was 4.16%, up 33 basis points from the prior quarter • Credit loss expense was $0.2 million; allowance for credit losses to loans was 1.11% at March 31, 2024 • Tangible common equity to tangible assets (1) was 9.23%, Common equity tier 1 capital ratio was 12.05% and total capital ratio was 15.20% ROAE 7.90% (1) Non - GAAP financial measure; refer to the non - GAAP reconciliation slide 4
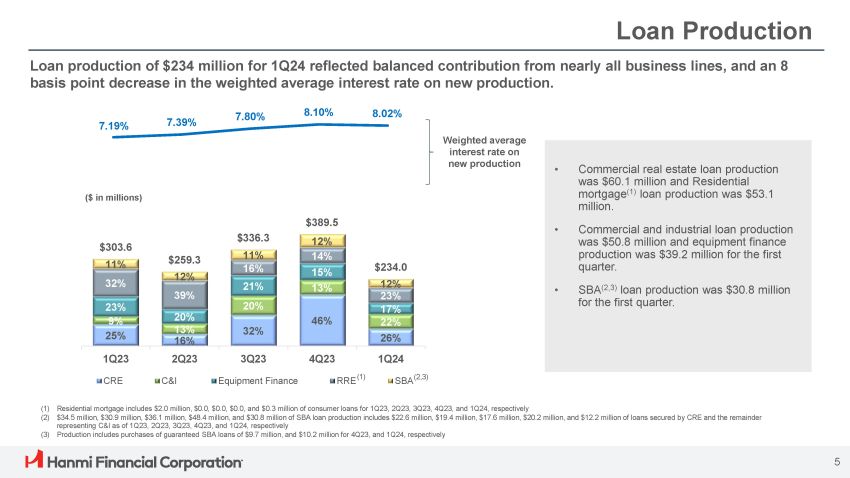
32% 46% 23% 9% 25% 11% 16% 21% 20% $303.6 11% 32% $259.3 12% 39% 20% 13% 16% $336.3 $389.5 12% 14% 15% 13% $234.0 12% 23% 17% 22% 26% 1Q23 2Q23 3Q23 4Q23 CRE C&I Equipment Finance RRE (1) 1Q24 SBA (2,3) 7.19% 7.39% 7.80% 8.10% 8.02% Loan Production • Commercial real estate loan production was $60.1 million and Residential mortgage (1) loan production was $53.1 million. • Commercial and industrial loan production was $50.8 million and equipment finance production was $39.2 million for the first quarter. • SBA (2,3) loan production was $30.8 million for the first quarter. Loan production of $234 million for 1Q24 reflected balanced contribution from nearly all business lines, and an 8 basis point decrease in the weighted average interest rate on new production. Weighted average interest rate on new production (1) Residential mortgage includes $2.0 million, $0.0, $0.0, $0.0, and $0.3 million of consumer loans for 1Q23, 2Q23, 3Q23, 4Q23, and 1Q24, respectively (2) $34.5 million, $30.9 million, $36.1 million, $48.4 million, and $30.8 million of SBA loan production includes $22.6 million, $19.4 million, $17.6 million, $20.2 million, and $12.2 million of loans secured by CRE and the remainder representing C&I as of 1Q23, 2Q23, 3Q23, 4Q23, and 1Q24, respectively (3) Production includes purchases of guaranteed SBA loans of $9.7 million, and $10.2 million for 4Q23, and 1Q24, respectively 5 ($ in millions)
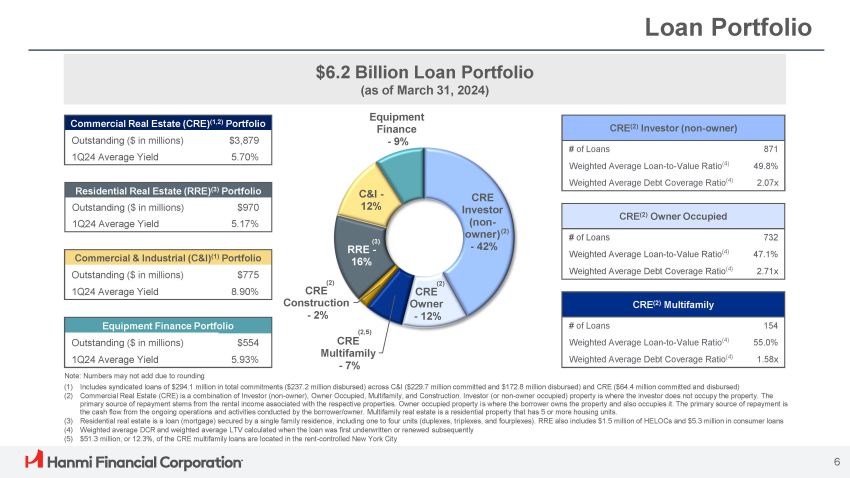
Loan Portfolio Commercial Real Estate (CRE) (1,2) Portfolio $3,879 Outstanding ($ in millions) 5.70% 1Q24 Average Yield $6.2 Billion Loan Portfolio (as of March 31, 2024) C&I - 12% 6 Equipment Finance - 9% CRE (2) Multifamily 154 # of Loans 55.0% Weighted Average Loan - to - Value Ratio (4) 1.58x Weighted Average Debt Coverage Ratio (4) CRE (2) Investor (non - owner) 871 # of Loans 49.8% Weighted Average Loan - to - Value Ratio (4) 2.07x Weighted Average Debt Coverage Ratio (4) CRE (2) Owner Occupied 732 # of Loans 47.1% Weighted Average Loan - to - Value Ratio (4) 2.71x Weighted Average Debt Coverage Ratio (4) Residential Real Estate (RRE) (3) Portfolio $970 Outstanding ($ in millions) 5.17% 1Q24 Average Yield Commercial & Industrial (C&I) (1) Portfolio $775 Outstanding ($ in millions) 8.90% 1Q24 Average Yield Equipment Finance Portfolio $554 Outstanding ($ in millions) 5.93% 1Q24 Average Yield Note: Numbers may not add due to rounding (1) Includes syndicated loans of $294.1 million in total commitments ($237.2 million disbursed) across C&I ($229.7 million committed and $172.8 million disbursed) and CRE ($64.4 million committed and disbursed) (2) Commercial Real Estate (CRE) is a combination of Investor (non - owner), Owner Occupied, Multifamily, and Construction. Investor (or non - owner occupied) property is where the investor does not occupy the property. The primary source of repayment stems from the rental income associated with the respective properties. Owner occupied property is where the borrower owns the property and also occupies it. The primary source of repayment is the cash flow from the ongoing operations and activities conducted by the borrower/owner. Multifamily real estate is a residential property that has 5 or more housing units. (3) Residential real estate is a loan (mortgage) secured by a single family residence, including one to four units (duplexes, triplexes, and fourplexes). RRE also includes $1.5 million of HELOCs and $5.3 million in consumer loans (4) Weighted average DCR and weighted average LTV calculated when the loan was first underwritten or renewed subsequently (5) $51.3 million, or 12.3%, of the CRE multifamily loans are located in the rent - controlled New York City (2) CRE Construction - 2% (2,5) CRE Multifamily - 7% (2) CRE Owner - 12% CRE Investor (non - owner) (2) - 42% (3) RRE - 16%
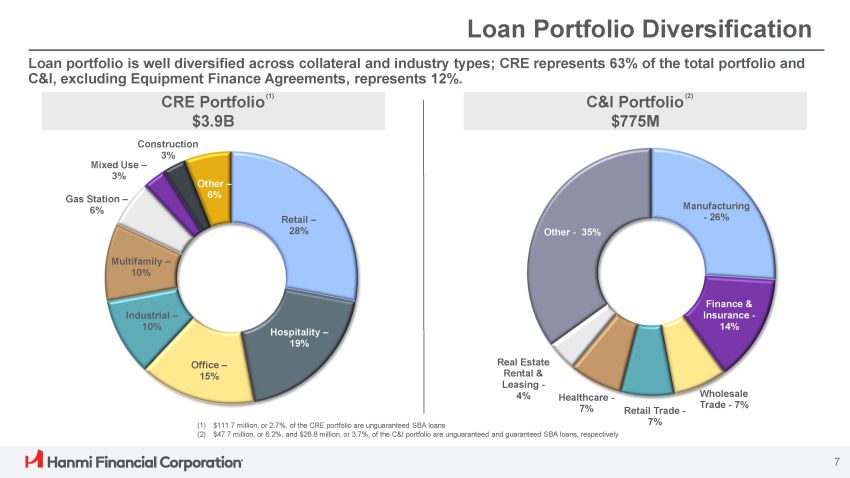
Loan Portfolio Diversification Loan portfolio is well diversified across collateral and industry types; CRE represents 63% of the total portfolio and C&I, excluding Equipment Finance Agreements, represents 12%. CRE Portfolio (1) $3.9B C&I Portfolio (2) $775M Retail – 28% Hospitality – 19% Office – 15% Industrial – 10% Multifamily – 10% Gas Station – 6% Construction 3% Mixed Use – 3% Other – 6% Manufacturing - 26% 7 Finance & Insurance - 14% Wholesale Trade - 7% Retail Trade - 7% Healthcare - 7% Real Estate Rental & Leasing - 4% Other - 35% (1) $111.7 million, or 2.7%, of the CRE portfolio are unguaranteed SBA loans (2) $47.7 million, or 6.2%, and $28.8 million, or 3.7%, of the C&I portfolio are unguaranteed and guaranteed SBA loans, respectively
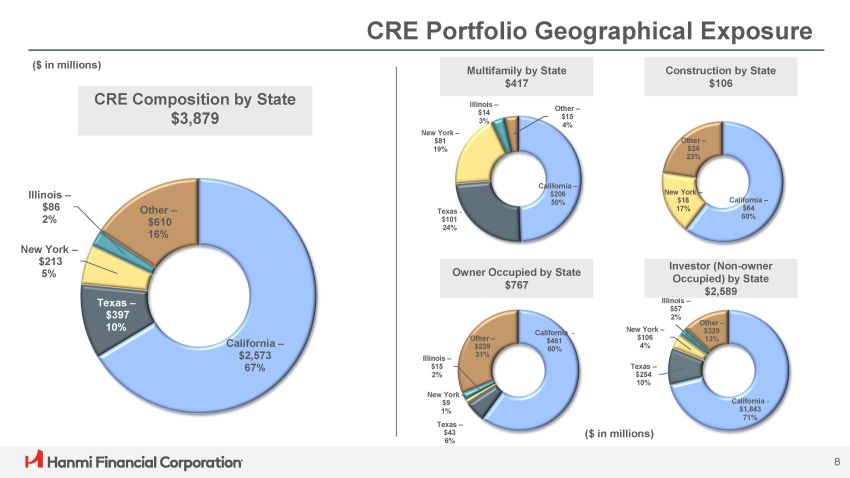
CRE Portfolio Geographical Exposure CRE Composition by State $3,879 Multifamily by State $417 Construction by State $106 Owner Occupied by State $767 Investor (Non - owner Occupied) by State $2,589 California – $2,573 67% Texas – $397 10% New York – $213 5% Illinois – $86 2% Other – $610 16% California – $206 50% Texas - $101 24% New York – $81 19% Illinois – $14 3% Other – $15 4% California – $64 60% New York – $18 17% Other – $24 23% California - $461 60% New York – $9 1% Texas – $43 6% Illinois – $15 2% Other – $239 31% California - $1,843 71% 8 Texas – $254 10% New York – $106 4% Illinois – $57 2% Other – $329 13% ($ in millions) ($ in millions)
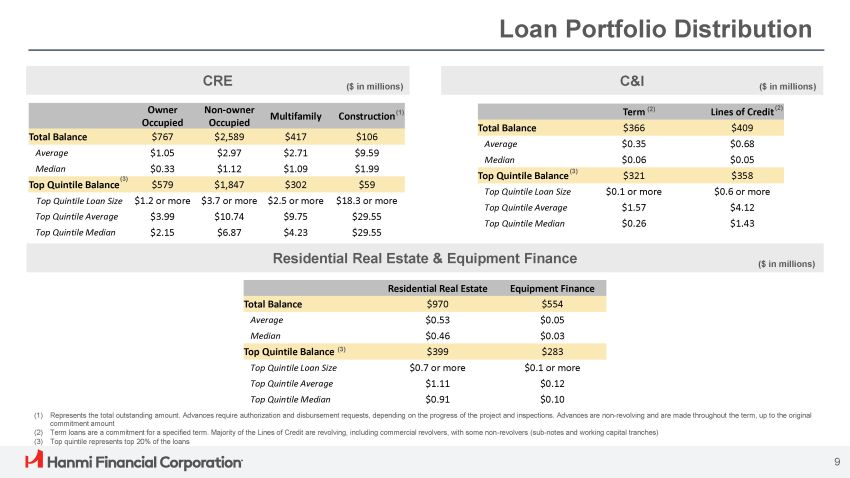
Loan Portfolio Distribution CRE C&I ($ in millions) ($ in millions) Construction (1) Multifamily Non - owner Occupied Owner Occupied $106 $417 $2,589 $767 Total Balance $9.59 $2.71 $2.97 $1.05 Average $1.99 $1.09 $1.12 $0.33 Median $59 $302 $1,847 $579 (3) Top Quintile Balance $18.3 or more $2.5 or more $3.7 or more $1.2 or more Top Quintile Loan Size $29.55 $9.75 $10.74 $3.99 Top Quintile Average $29.55 $4.23 $6.87 $2.15 Top Quintile Median Lines of Credit (2) Term (2) $409 $366 Total Balance $0.68 $0.35 Average $0.05 $0.06 Median $358 $321 Top Quintile Balance (3) $0.6 or more $0.1 or more Top Quintile Loan Size $4.12 $1.57 Top Quintile Average $1.43 $0.26 Top Quintile Median Residential Real Estate & Equipment Finance 9 Equipment Finance Residential Real Estate $554 $970 Total Balance $0.05 $0.53 Average $0.03 $0.46 Median $283 $399 Top Quintile Balance (3) $0.1 or more $0.7 or more Top Quintile Loan Size $0.12 $1.11 Top Quintile Average $0.10 $0.91 Top Quintile Median ($ in millions) (1) Represents the total outstanding amount. Advances require authorization and disbursement requests, depending on the progress of the project and inspections. Advances are non - revolving and are made throughout the term, up to the original commitment amount (2) Term loans are a commitment for a specified term. Majority of the Lines of Credit are revolving, including commercial revolvers, with some non - revolvers (sub - notes and working capital tranches) (3) Top quintile represents top 20% of the loans
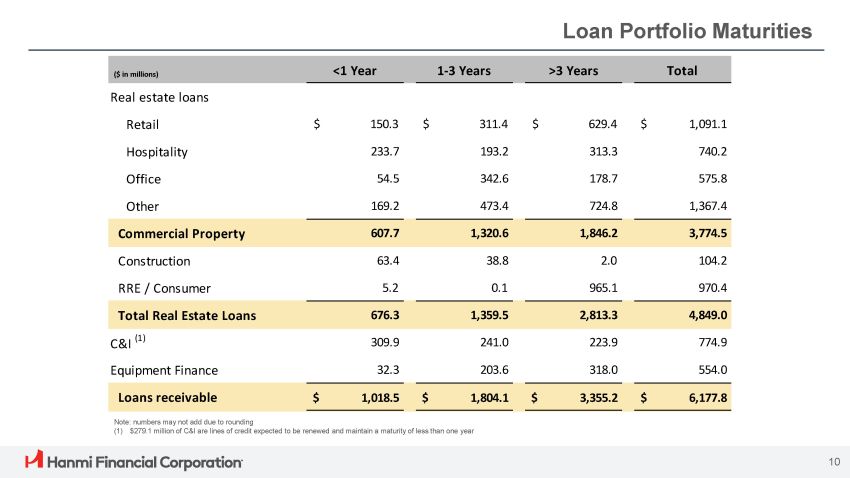
<1 Year 1 - 3 Years >3 Years Total Real estate loans $ 1,091.1 $ 629.4 $ 311.4 $ 150.3 Retail 740.2 313.3 193.2 233.7 Hospitality 575.8 178.7 342.6 54.5 Office 1,367.4 724.8 473.4 169.2 Other 3,774.5 1,846.2 1,320.6 607.7 Commercial Property 104.2 2.0 38.8 63.4 Construction 970.4 965.1 0.1 5.2 RRE / Consumer 4,849.0 2,813.3 1,359.5 676.3 Total Real Estate Loans 774.9 223.9 241.0 309.9 C&I (1) 554.0 318.0 203.6 32.3 Equipment Finance $ 6,177.8 $ 3,355.2 $ 1,804.1 $ 1,018.5 Loans receivable 10 Loan Portfolio Maturities ($ in millions) Note: numbers may not add due to rounding (1) $279.1 million of C&I are lines of credit expected to be renewed and maintain a maturity of less than one year
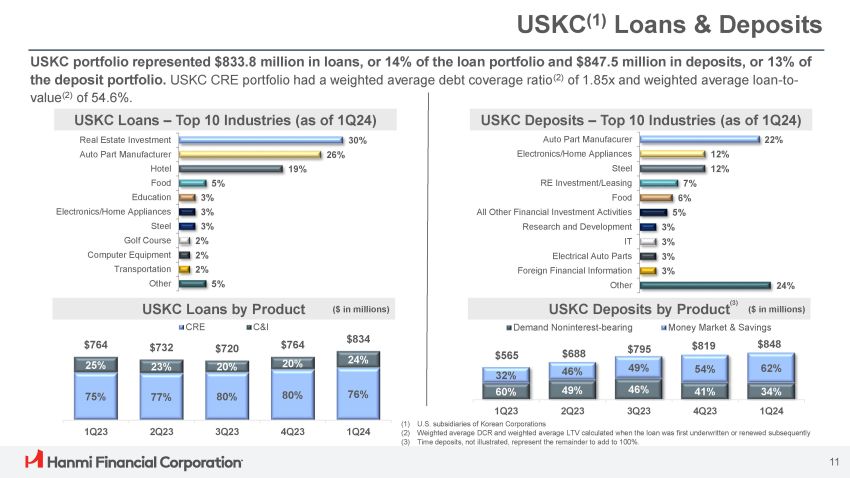
USKC (1) Loans & Deposits 30% 26% 19% 5% 3% 3% 3% 2% 2% 2% 5% Real Estate Investment Auto Part Manufacturer Hotel Food Education Electronics/Home Appliances Steel Golf Course Computer Equipment Transportation Other USKC portfolio represented $833.8 million in loans, or 14% of the loan portfolio and $847.5 million in deposits, or 13% of the deposit portfolio. USKC CRE portfolio had a weighted average debt coverage ratio (2) of 1.85x and weighted average loan - to - value (2) of 54.6%. USKC Loans – Top 10 Industries (as of 1Q24) $834 $764 $720 $732 $764 24% 20% 20% 23% 25% 76% 80% 80% 77% 75% 1Q24 4Q23 3Q23 2Q23 1Q23 USKC Loans by Product CRE C&I ($ in millions) USKC Deposits – Top 10 Industries (as of 1Q24) 22% Auto Part Manufacurer 12% Electronics/Home Appliances 12% Steel 7% RE Investment/Leasing 6% Food 5% All Other Financial Investment Activities 3% Research and Development 3% IT 3% Electrical Auto Parts 3% Foreign Financial Information 24% Other $848 $819 $795 $688 $565 62% 54% 49% 46% 32% 34% 41% 46% 49% 60% 1Q24 4Q23 3Q23 2Q23 1Q23 Demand Noninterest - bearing Money Market & Savings USKC Deposits by Product 11 ($ in millions) (1) U.S. subsidiaries of Korean Corporations (2) Weighted average DCR and weighted average LTV calculated when the loan was first underwritten or renewed subsequently (3) Time deposits, not illustrated, represent the remainder to add to 100%. (3)
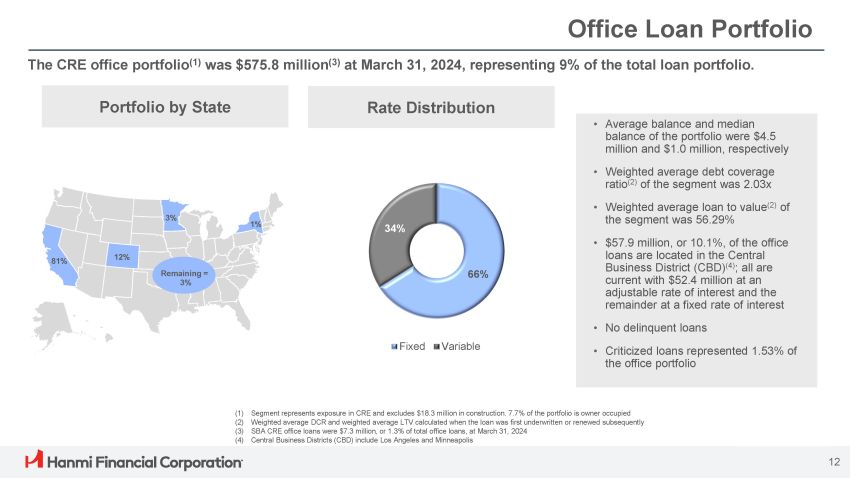
Office Loan Portfolio The CRE office portfolio (1) was $575.8 million (3) at March 31, 2024, representing 9% of the total loan portfolio. 81% 12% 3% Remaining = 3% 1% Portfolio by State • Average balance and median balance of the portfolio were $4.5 million and $1.0 million, respectively • Weighted average debt coverage ratio (2) of the segment was 2.03x • Weighted average loan to value (2) of the segment was 56.29% • $57.9 million, or 10.1%, of the office loans are located in the Central Business District (CBD) (4) ; all are current with $52.4 million at an adjustable rate of interest and the remainder at a fixed rate of interest • No delinquent loans • Criticized loans represented 1.53% of the office portfolio Rate Distribution (1) Segment represents exposure in CRE and excludes $18.3 million in construction. 7.7% of the portfolio is owner occupied (2) Weighted average DCR and weighted average LTV calculated when the loan was first underwritten or renewed subsequently (3) SBA CRE office loans were $7.3 million, or 1.3% of total office loans, at March 31, 2024 (4) Central Business Districts (CBD) include Los Angeles and Minneapolis 66% 34% Fixed Variable 12
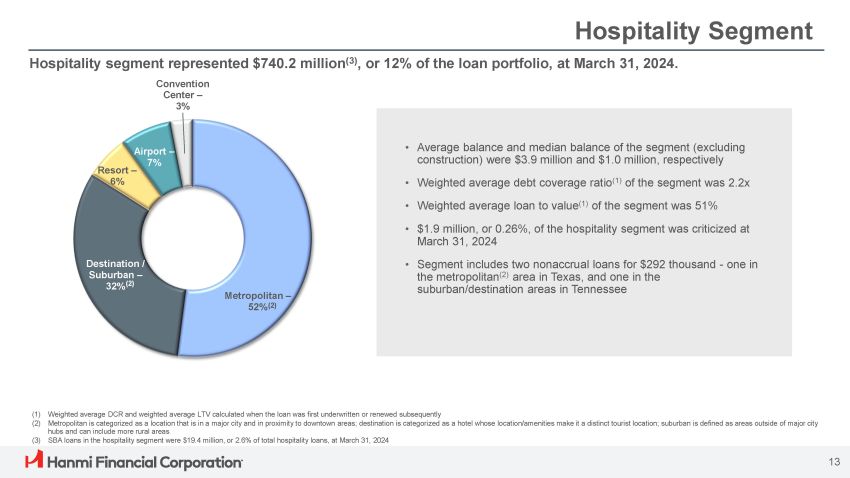
Resort – 6% 13 Airport – 7% Metropolitan – 52% (2) Destination / Suburban – 32% (2) Hospitality Segment Hospitality segment represented $740.2 million (3) , or 12% of the loan portfolio, at March 31, 2024. Convention Center – 3% (1) Weighted average DCR and weighted average LTV calculated when the loan was first underwritten or renewed subsequently (2) Metropolitan is categorized as a location that is in a major city and in proximity to downtown areas; destination is categorized as a hotel whose location/amenities make it a distinct tourist location; suburban is defined as areas outside of major city hubs and can include more rural areas (3) SBA loans in the hospitality segment were $19.4 million, or 2.6% of total hospitality loans, at March 31, 2024 • Average balance and median balance of the segment (excluding construction) were $3.9 million and $1.0 million, respectively • Weighted average debt coverage ratio (1) of the segment was 2.2x • Weighted average loan to value (1) of the segment was 51% • $1.9 million, or 0.26%, of the hospitality segment was criticized at March 31, 2024 • Segment includes two nonaccrual loans for $292 thousand - one in the metropolitan (2) area in Texas, and one in the suburban/destination areas in Tennessee
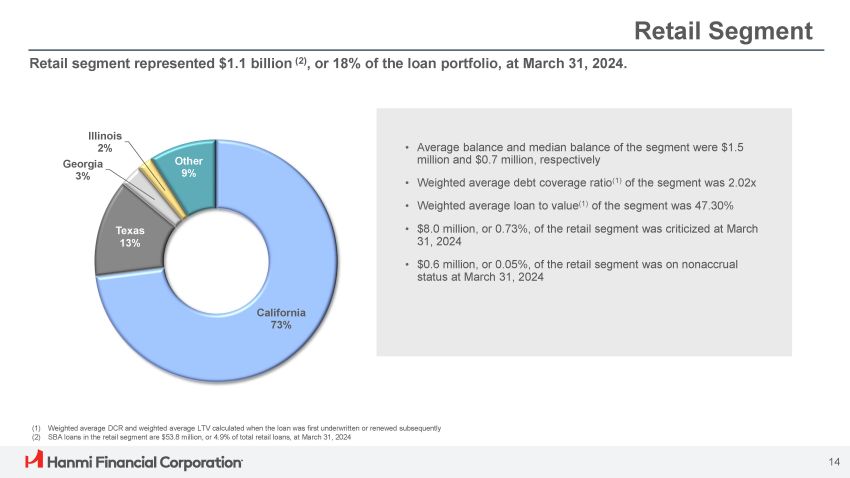
Retail Segment Retail segment represented $1.1 billion (2) , or 18% of the loan portfolio, at March 31, 2024. (1) Weighted average DCR and weighted average LTV calculated when the loan was first underwritten or renewed subsequently (2) SBA loans in the retail segment are $53.8 million, or 4.9% of total retail loans, at March 31, 2024 • Average balance and median balance of the segment were $1.5 million and $0.7 million, respectively • Weighted average debt coverage ratio (1) of the segment was 2.02x • Weighted average loan to value (1) of the segment was 47.30% • $8.0 million, or 0.73%, of the retail segment was criticized at March 31, 2024 • $0.6 million, or 0.05%, of the retail segment was on nonaccrual status at March 31, 2024 California 73% 14 Texas 13% Illinois 2% Georgia 3% Other 9%
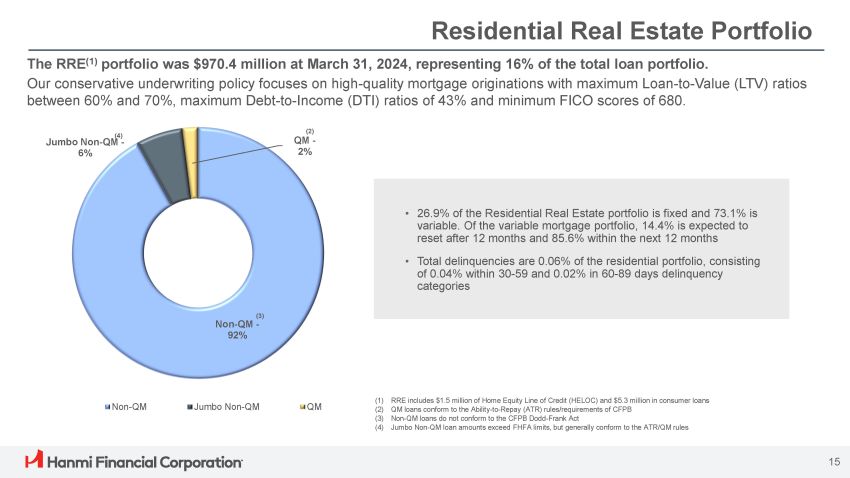
Residential Real Estate Portfolio Jumbo Non - QM - 6% (2) QM - 2% (3) Non - QM - 92% Non - QM Jumbo Non - QM QM 15 The RRE (1) portfolio was $970.4 million at March 31, 2024, representing 16% of the total loan portfolio. Our conservative underwriting policy focuses on high - quality mortgage originations with maximum Loan - to - Value (LTV) ratios between 60% and 70%, maximum Debt - to - Income (DTI) ratios of 43% and minimum FICO scores of 680. (1) RRE includes $1.5 million of Home Equity Line of Credit (HELOC) and $5.3 million in consumer loans (2) QM loans conform to the Ability - to - Repay (ATR) rules/requirements of CFPB (3) Non - QM loans do not conform to the CFPB Dodd - Frank Act (4) Jumbo Non - QM loan amounts exceed FHFA limits, but generally conform to the ATR/QM rules • 26.9% of the Residential Real Estate portfolio is fixed and 73.1% is variable. Of the variable mortgage portfolio, 14.4% is expected to reset after 12 months and 85.6% within the next 12 months • Total delinquencies are 0.06% of the residential portfolio, consisting of 0.04% within 30 - 59 and 0.02% in 60 - 89 days delinquency categories (4)
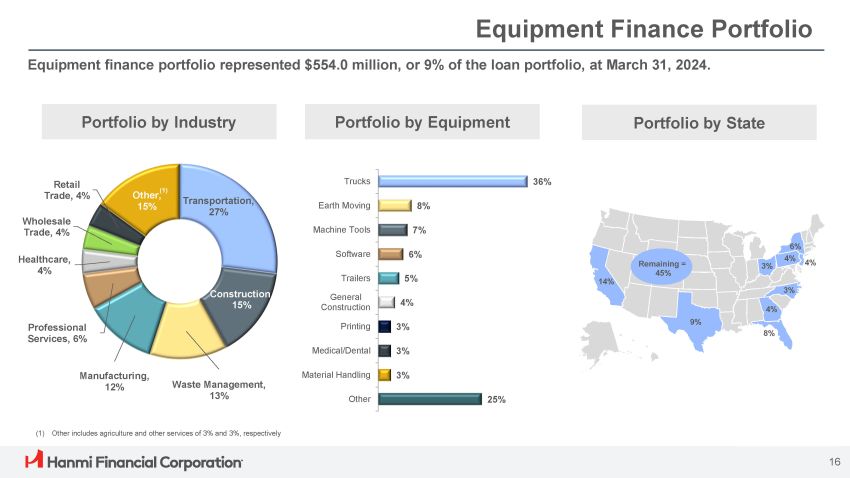
Equipment Finance Portfolio Equipment finance portfolio represented $554.0 million, or 9% of the loan portfolio, at March 31, 2024. Transportation, 27% Construction, 15% Waste Management, 13% Manufacturing, 12% Professional Services, 6% Healthcare, 4% Wholesale Trade, 4% Retail Trade, 4% Other, (1) 15% 8% 7% 6% 5% 4% 3% Trucks Earth Moving Machine Tools Software Trailers General Construction Printing 3% Medical/Dental 3% Material Handling 25% Other 36% Portfolio by Industry Portfolio by Equipment Portfolio by State 14% 16 9% 4% 8% 6% 4% 3% 3% Remaining = 45% 4% (1) Other includes agriculture and other services of 3% and 3%, respectively
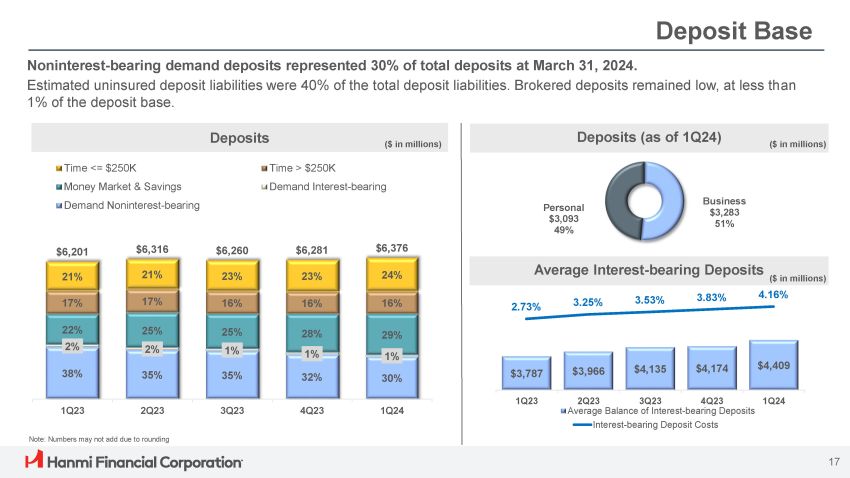
2.73% 3.25% 3.53% 3.83% 4.16% 2Q23 3Q23 4Q23 Average Balance of Interest - bearing Deposits Interest - bearing Deposit Costs $3,787 $3,966 $4,135 $4,174 $4,409 1Q23 1Q24 Deposit Base Noninterest - bearing demand deposits represented 30% of total deposits at March 31, 2024. Estimated uninsured deposit liabilities were 40% of the total deposit liabilities. Brokered deposits remained low, at less than 1% of the deposit base. Note: Numbers may not add due to rounding Deposits ($ in millions) Deposits (as of 1Q24) Average Interest - bearing Deposits ($ in millions) Business $3,283 51% Personal $3,093 49% ($ in millions) 38% 32% 30% 2% 1% 1% 22% 25% 25% 1% 2% 35% 35% 28% 29% $6,37 $6,281 $6,260 $6,316 $6,201 24% 23% 23% 21% 21% 16% 16% 16% 17% 17% 6 1Q23 2Q23 3Q23 4Q23 1Q24 Time <= $250K Money Market & Savings Demand Noninterest - bearing Time > $250K Demand Interest - bearing 17
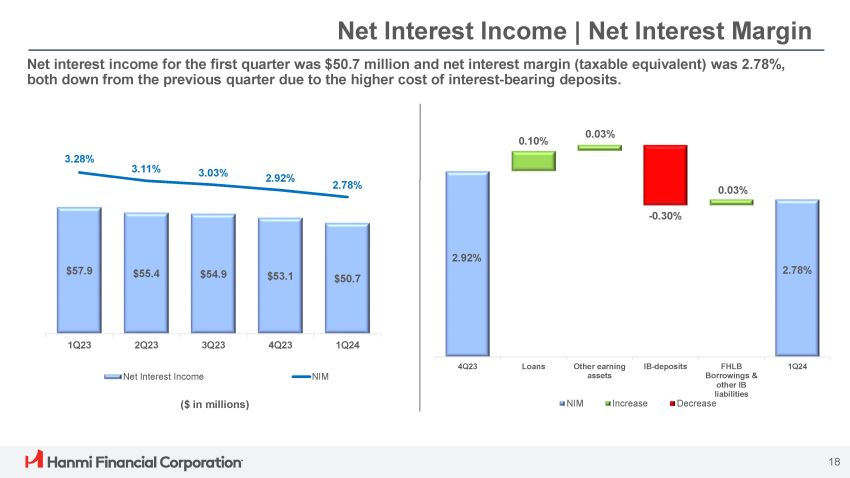
Net Interest Income | Net Interest Margin Net interest income for the first quarter was $50.7 million and net interest margin (taxable equivalent) was 2.78%, both down from the previous quarter due to the higher cost of interest - bearing deposits. ($ in millions) 2.92% 0.10% 0.03% - 0.30% 0.03% 2.78% 4Q23 Loans Other earning assets IB - deposits FHLB Borrowings & other IB liabilities Decrease 1Q24 NIM Increase $57.9 $55.4 $54.9 $53.1 $50.7 3.28% 3.11% 3.03% 2.92% 2.78% 1Q23 2Q23 3Q23 4Q23 1Q24 Net Interest Income NIM 18
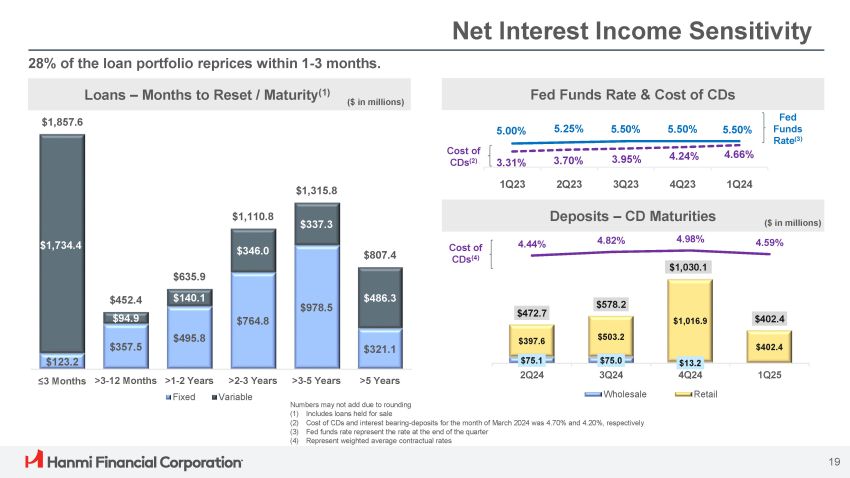
Net Interest Income Sensitivity 28% of the loan portfolio reprices within 1 - 3 months. $123.2 $357.5 $495.8 $764.8 $978.5 $321.1 $1,734.4 $140.1 $346.0 $337.3 $486.3 $452.4 $94.9 $1,857.6 $635.9 $1,110.8 $1,315.8 $807.4 ≤3 Months >3 - 5 Years >5 Years >3 - 12 Months >1 - 2 Years Fixed >2 - 3 Years Variable Loans – Months to Reset / Maturity (1) ( . $ in millions) Fed Funds Rate & Cost of CDs $75.1 $75.0 $13.2 $397.6 $503.2 $1,016.9 $402.4 $472.7 $578.2 $1,030.1 $402.4 4.44% 4.82% 4.98% 4.59% 2Q24 1Q25 3Q24 Wholesale 4Q24 Retail ($ in millions) 2Q23 3Q23 4Q23 Deposits – CD Maturities 5.00% 5.25% 5.50% 5.50% 5.50% 3.31% 3.70% 3.95% 4.24% 4.66% 1Q23 1Q24 Fed Funds Rate (3) Cost of CDs (2) Cost of CDs (4) Numbers may not add due to rounding (1) Includes loans held for sale (2) Cost of CDs and interest bearing - deposits for the month of March 2024 was 4.70% and 4.20%, respectively (3) Fed funds rate represent the rate at the end of the quarter (4) Represent weighted average contractual rates 19
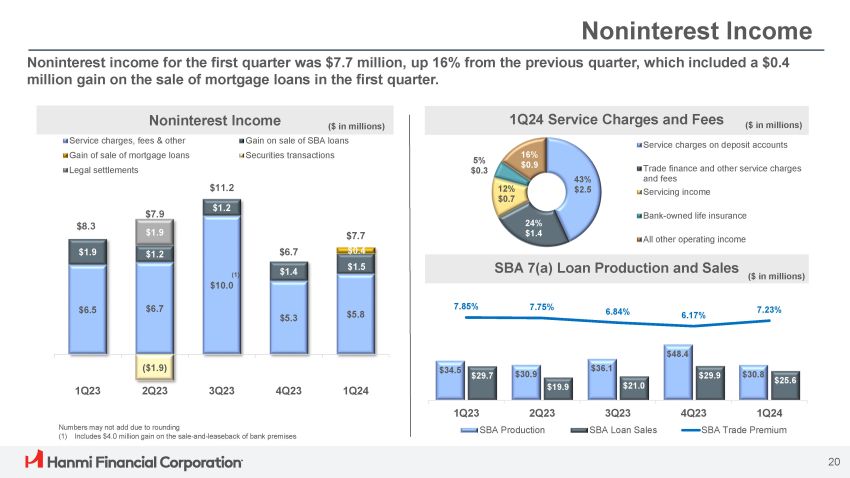
43% $2.5 24% $1.4 12% $0.7 5% $0.3 16% $0.9 Service charges on deposit accounts Trade finance and other service charges and fees Servicing income Bank - owned life insurance All other operating income Noninterest Income SBA 7(a) Loan Production and Sales ($ in millions) $34.5 $30.9 $36.1 $48.4 $30.8 $29.7 $19.9 $21.0 $29.9 $25.6 7.85% 7.75% 6.84% 6.17% 7.23% 1Q23 2Q23 3Q23 SBA Loan Sales SBA Production 4Q23 1Q24 SBA Trade Premium Noninterest income for the first quarter was $7.7 million, up 16% from the previous quarter, which included a $0.4 million gain on the sale of mortgage loans in the first quarter. Noninterest Income 1Q24 Service Charges and Fees ($ in millions) ($ in millions) $6.5 $6.7 $5.3 $5.8 $1.9 $1.2 $1.2 $1.4 ($1.9) $8.3 $7.9 $1.9 $11.2 $6.7 $7.7 $0.4 $1.5 1Q23 2Q23 3Q23 4Q23 1Q24 (1) $10.0 Gain on sale of SBA loans Securities transactions Service charges, fees & other Gain of sale of mortgage loans Legal settlements Numbers may not add due to rounding (1) Includes $4.0 million gain on the sale - and - leaseback of bank premises 20
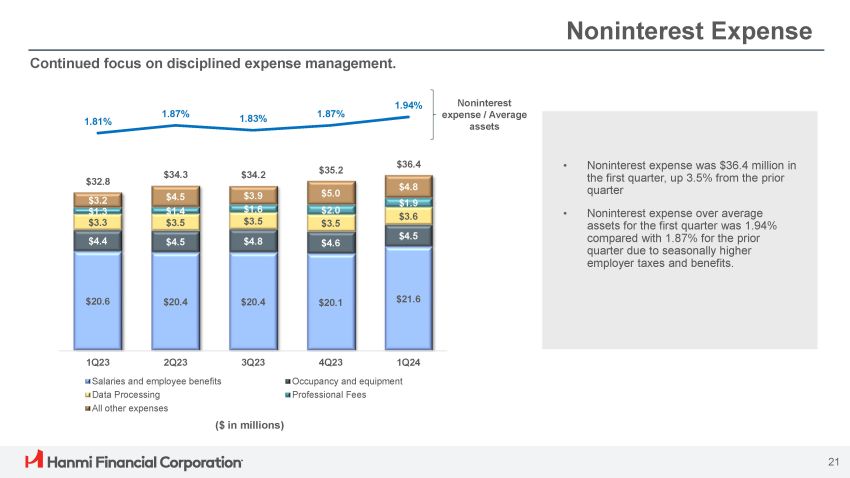
Noninterest Expense • Noninterest expense was $36.4 million in the first quarter, up 3.5% from the prior quarter • Noninterest expense over average assets for the first quarter was 1.94% compared with 1.87% for the prior quarter due to seasonally higher employer taxes and benefits. Continued focus on disciplined expense management. Noninterest expense / Average assets $20.6 $20.4 $20.4 $20.1 $21.6 $4.8 $1.9 $3.6 $4.5 $35.2 $34.2 $34.3 $32.8 $5.0 $3.9 $4.5 $3.2 $2.0 $1.6 $1.4 $1.3 $3.5 $3.5 $3.5 $3.3 $4.6 $4.8 $4.5 $4.4 $36.4 1.81% 1.87% 1.83% 1.87% 1.94% 4Q23 1Q24 Occupancy and equipment Professional Fees 1Q23 2Q23 3Q23 Salaries and employee benefits Data Processing All other expenses ($ in millions) 21
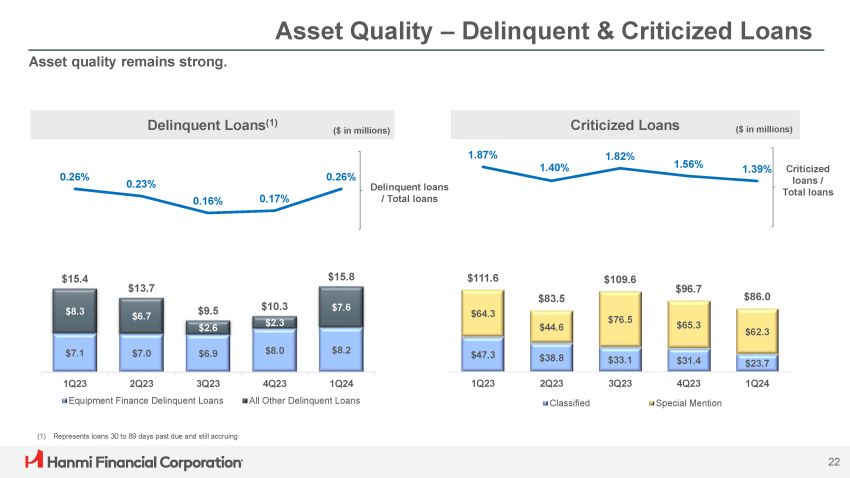
Asset Quality – Delinquent & Criticized Loans Delinquent loans / Total loans $47.3 $38.8 $33.1 $31.4 $23.7 $64.3 $44.6 $76.5 $65.3 $62.3 $111.6 $83.5 $109.6 $96.7 $86.0 1.87% 1.40% 1.82% 1.56% 1.39% 1Q23 2Q23 3Q23 4Q23 1Q24 Classified Special Mention Delinquent Loans (1) Criticized Loans Criticized loans / Total loans Asset quality remains strong. $7.1 $7.0 $6.9 $8.0 $8.2 $8.3 $6.7 $7.6 $15.4 $13.7 $9.5 $2.6 $10.3 $2.3 $15.8 0.26% 0.23% 0.16% 0.17% 0.26% 1Q23 2Q23 3Q23 Equipment Finance Delinquent Loans 4Q23 1Q24 All Other Delinquent Loans ($ in millions) 22 ($ in millions) (1) Represents loans 30 to 89 days past due and still accruing
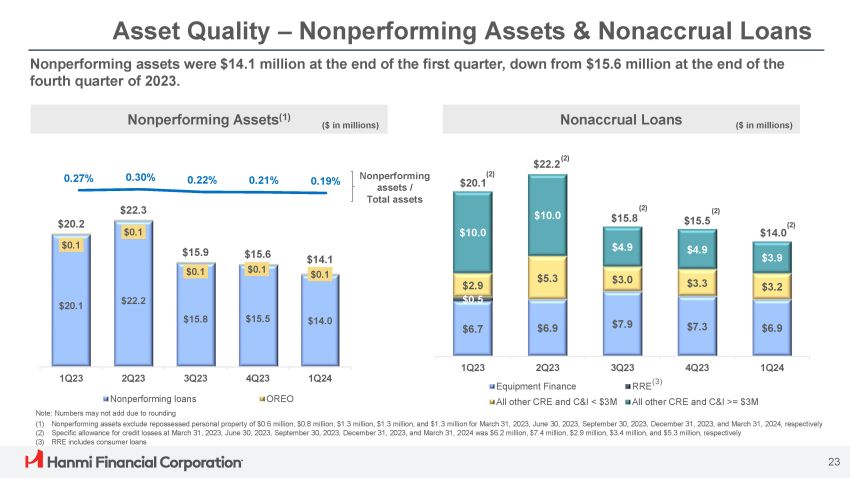
$20.1 $22.2 $15.8 $15.5 $14.0 $0.1 $0.1 $0.1 $0.1 $0.1 $20.2 $22.3 $15.9 $15.6 $14.1 4Q23 1Q24 1Q23 2Q23 3Q23 Nonperforming loans Note: Numbers may not add due to rounding OREO Asset Quality – Nonperforming Assets & Nonaccrual Loans 0.27% 0.30% 0.22% 0.21% 0.19% Nonperforming assets / Total assets Nonperforming Assets (1) Nonaccrual Loans Nonperforming assets were $14.1 million at the end of the first quarter, down from $15.6 million at the end of the fourth quarter of 2023. ($ in millions) ($ in millions) (1) Nonperforming assets exclude repossessed personal property of $0.6 million, $0.8 million, $1.3 million, $1.3 million, and $1.3 million for March 31, 2023, June 30, 2023, September 30, 2023, December 31, 2023, and March 31, 2024, respectively (2) Specific allowance for credit losses at March 31, 2023, June 30, 2023, September 30, 2023, December 31, 2023, and March 31, 2024 was $6.2 million, $7.4 million, $2.9 million, $3.4 million, and $5.3 million, respectively (3) RRE includes consumer loans $2.9 $0.5 $5.3 $3.0 $3.3 $3.2 $10.0 $10.0 $4.9 $4.9 $3.9 (2) $22.2 $15.8 $15.5 $14.0 $6.9 $7.3 $7.9 $6.9 $6.7 1Q24 4Q23 3Q23 2Q23 1Q23 Equipment Finance All other CRE and C&I < $3M RRE (3) All other CRE and C&I >= $3M 23 (2) (2) $20.1 (2) (2)
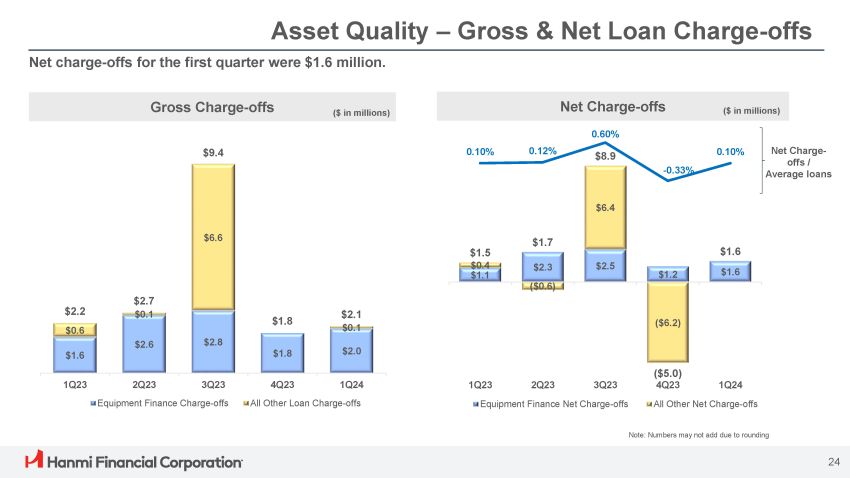
Asset Quality – Gross & Net Loan Charge - offs Gross Charge - offs Net Charge - offs Net Charge - offs / Average loans Net charge - offs for the first quarter were $1.6 million. ($ in millions) ($ in millions) $1.6 $2.6 $2.8 $1.8 $2.0 $6.6 $2.2 $0.6 $2.7 $0.1 $9.4 $1.8 $2.1 $0.1 1Q23 2Q23 3Q23 Equipment Finance Charge - offs 4Q23 1Q24 All Other Loan Charge - offs Note: Numbers may not add due to rounding $2.5 $1.2 $1.6 $2.3 ($0.6) $6.4 ($6.2) $1.5 $0.4 $1.1 $1.7 $8.9 ($5.0) 4Q23 1Q24 All Other Net Charge - offs $1.6 0.10% 0.12% 0.60% - 0.33% 0.10% 1Q23 2Q23 3Q23 Equipment Finance Net Charge - offs 24
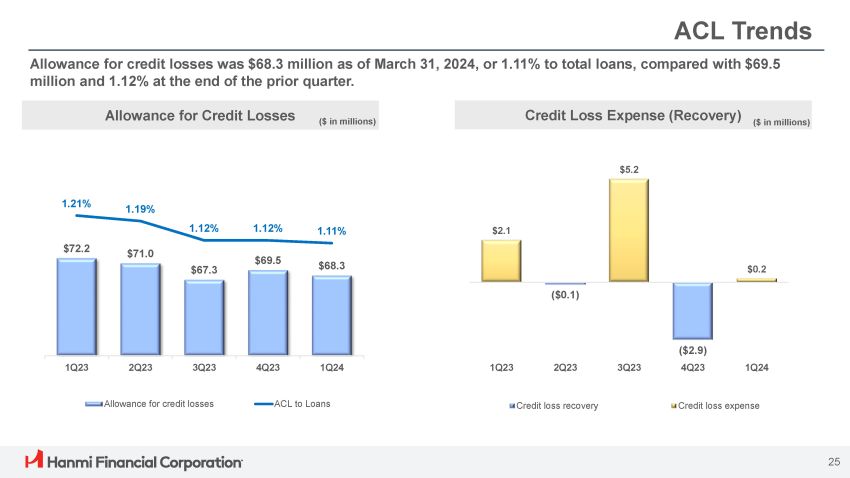
ACL Trends Allowance for credit losses was $68.3 million as of March 31, 2024, or 1.11% to total loans, compared with $69.5 million and 1.12% at the end of the prior quarter. $72.2 $71.0 $67.3 $69.5 $68.3 1.21% 1.19% 1.12% 1.12% 1.11% 1Q23 2Q23 3Q23 4Q23 1Q24 Allowance for credit losses ACL to Loans ($0.1) $2.1 $5.2 $0.2 ($2.9) 4Q23 1Q23 2Q23 3Q23 1Q24 Credit loss recovery Credit loss expense Allowance for Credit Losses Credit Loss Expense (Recovery) 25 ($ in millions) ($ in millions)
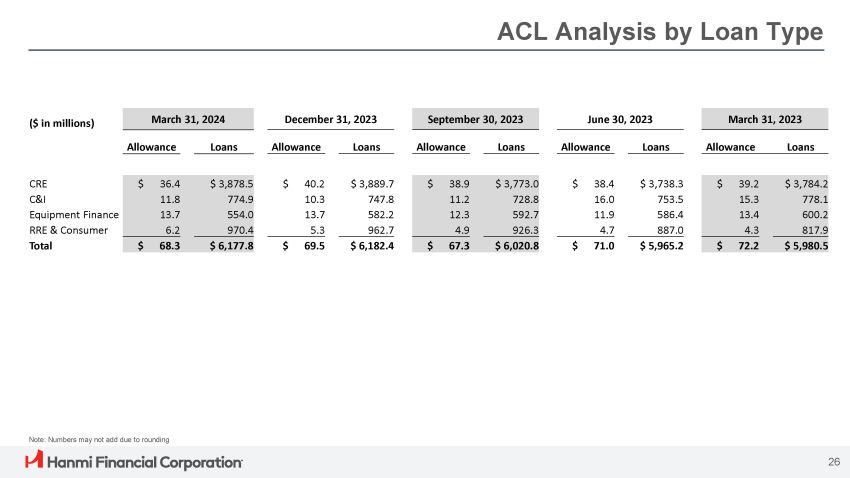
ACL Analysis by Loan Type March 31, 2023 June 30, 2023 September 30, 2023 December 31, 2023 March 31, 2024 ($ in millions) Loans Allowance Loans Allowance Loans Allowance Loans Allowance Loans Allowance $ 3,784.2 $ 39.2 $ 3,738.3 $ 38.4 $ 3,773.0 $ 38.9 $ 3,889.7 $ 40.2 $ 3,878.5 $ 36.4 CRE 778.1 15.3 753.5 16.0 728.8 11.2 747.8 10.3 774.9 11.8 C&I 600.2 13.4 586.4 11.9 592.7 12.3 582.2 13.7 554.0 13.7 Equipment Finance 817.9 4.3 887.0 4.7 926.3 4.9 962.7 5.3 970.4 6.2 RRE & Consumer $ 5,980.5 $ 72.2 $ 5,965.2 $ 71.0 $ 6,020.8 $ 67.3 $ 6,182.4 $ 69.5 $ 6,177.8 $ 68.3 Total Note: Numbers may not add due to rounding 26
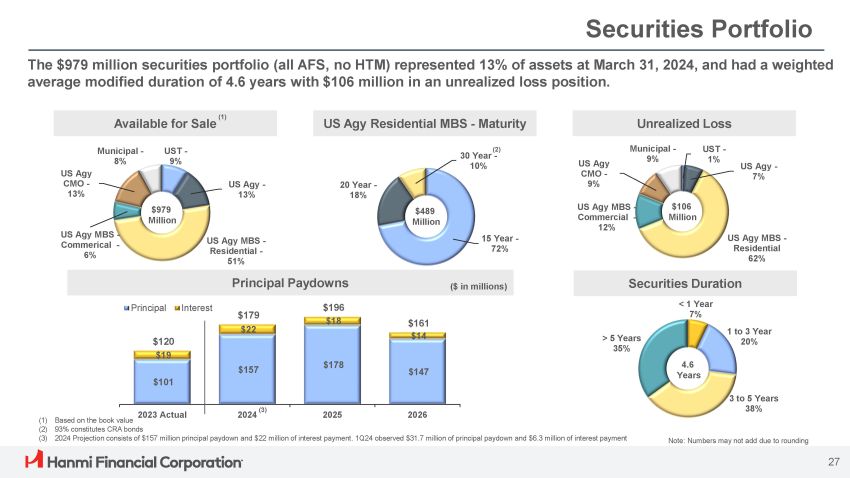
US Agy Residential MBS - Maturity 15 Year - 72% 20 Year - 18% 30 Year - 10% Securities Portfolio The $979 million securities portfolio (all AFS, no HTM) represented 13% of assets at March 31, 2024, and had a weighted average modified duration of 4.6 years with $106 million in an unrealized loss position. Principal Paydowns ($ in millions) $101 $157 $178 $147 $120 $19 $179 $22 $196 $18 $161 $14 2025 2026 Principal Interest Unrealized Loss UST - 1% US Agy - 7% US Agy MBS - Residential 62% US Agy MBS - Commercial - 12% US Agy CMO - 9% Municipal - 9% Available for Sale UST - 9% US Agy - 13% US Agy MBS - Residential - 51% US Agy MBS - Commerical - 6% US Agy CMO - 13 % Municipal - 8% $979 Million Securities Duration < 1 Year 7% 1 to 3 Year 20% 3 to 5 Years 38% > 5 Years 35% 4.6 Years $489 Million $106 Million (1) Based on the book value 2023 Actual (3) 2024 Projection consists of $157 million principal paydown and $22 million of interest payment. 1Q24 observed $31.7 million of principal paydown and $6.3 million of interest payment Note: Numbers may not add due to rounding 27 (2) 93% constitutes CRA bonds 2024 (3) (2) (1)
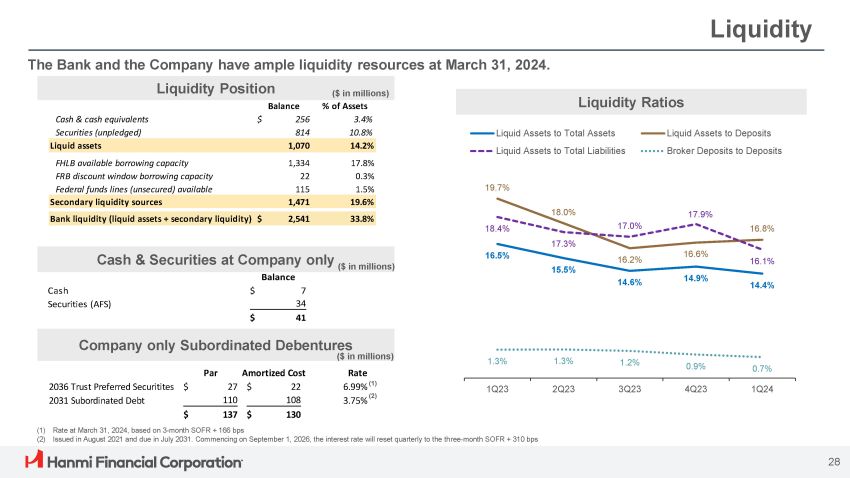
Balance 256 814 % of Assets 3.4% 10.8% Cash & cash equivalents $ Securities (unpledged) Liquid assets 1,070 14.2% FHLB available borrowing capacity FRB discount window borrowing capacity Federal funds lines (unsecured) available Liquid Assets to Total Liabilities 1,334 22 115 17.8% 0.3% 1.5% Secondary liquidity sources 1,471 19.6% Bank liquidity (liquid assets + secondary liquidity) $ 2,541 33.8% Liquidity The Bank and the Company have ample liquidity resources at March 31, 2024. (1) Rate at March 31, 2024, based on 3 - month SOFR + 166 bps (2) Issued in August 2021 and due in July 2031. Commencing on September 1, 2026, the interest rate will reset quarterly to the three - month SOFR + 310 bps Liquidity Position ($ in millions) 16.5% 15.5% 14.6% 14.9% 14.4% 19.7% 18.0% 16.2% 16.6% 16.8% 18.4% 17.3% 17.0% 17.9% 16.1% 1.3% 1.3% 1.2% 0.9% 0.7% 1Q23 2Q23 3Q23 4Q23 1Q24 Liquid Assets to Total Assets Liquid Assets to Deposits Broker Deposits to Deposits Liquidity Ratios 28 Par Amortized Cost 2036 Trust Preferred Securitites $ 27 $ 22 Rate 6.99% (1) (2) 3.75% 108 110 2031 Subordinated Debt $ 130 $ 137 Company only Subordinated Debentures ($ in millions) Cash & Securities at Company only ($ in millions) Balance Cash $ 7 Securities (AFS) 34 $ 41
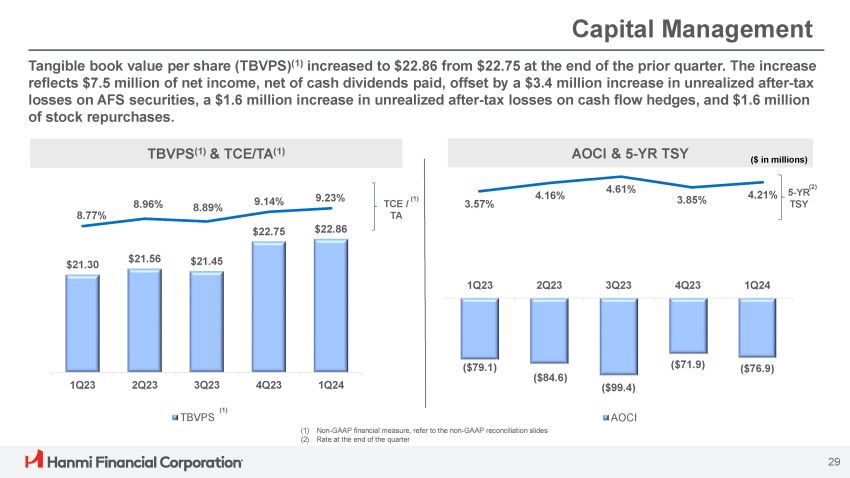
(1) Non - GAAP financial measure, refer to the non - GAAP reconciliation slides (2) Rate at the end of the quarter Capital Management Tangible book value per share (TBVPS) (1) increased to $22.86 from $22.75 at the end of the prior quarter. The increase reflects $7.5 million of net income, net of cash dividends paid, offset by a $3.4 million increase in unrealized after - tax losses on AFS securities, a $1.6 million increase in unrealized after - tax losses on cash flow hedges, and $1.6 million of stock repurchases. 3.57% 4.16% 4.61% 3.85% 4.21% ($79.1) ($84.6) ($99.4) ($71.9) ($76.9) 1Q23 2Q23 3Q23 4Q23 1Q24 AOCI $21.30 $21.56 $21.45 $22.75 $22.86 8.77% 8.96% 8.89% 9.14% 9.23% 1Q23 2Q23 3Q23 4Q23 1Q24 (1) TBVPS TBVPS (1) & TCE/TA (1) AOCI & 5 - YR TSY 5 - YR TSY (2) TCE / TA ($ in millions) (1) 29
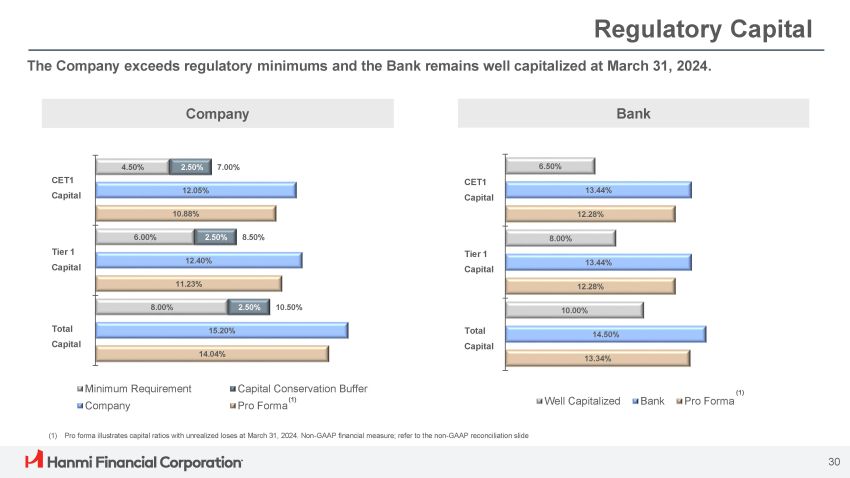
Regulatory Capital The Company exceeds regulatory minimums and the Bank remains well capitalized at March 31, 2024. 8.00% 6.00% 4.50% 2.50% 2.50% 2.50% 15.20% 12.40% 12.05% 14.04% 11.23% 10.88% 10.50% 8.50% 7.00% Minimum Requirement Company Capital Conservation Buffer (1) Pro Forma 10.00% 8.00% 6.50% 14.50% 13.44% 13.44% 13.34% 12.28% 12.28% Well Capitalized Bank Pro Forma 30 CET1 Capital Tier 1 Capital Total Capital Company Bank CET1 Capital Tier 1 Capital Total Capital (1) Pro forma illustrates capital ratios with unrealized loses at March 31, 2024. Non - GAAP financial measure; refer to the non - GAAP reconciliation slide (1)

Appendix 31
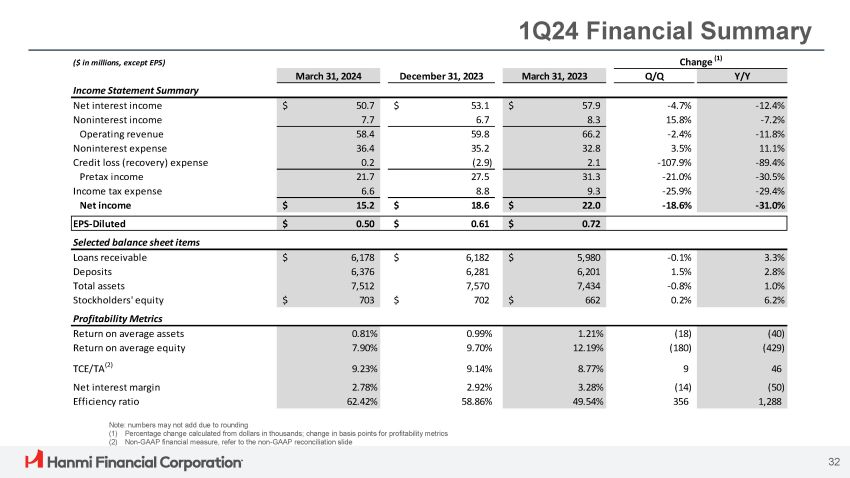
1Q24 Financial Summary Note: numbers may not add due to rounding (1) Percentage change calculated from dollars in thousands; change in basis points for profitability metrics (2) Non - GAAP financial measure, refer to the non - GAAP reconciliation slide $ 0.72 $ 0.61 $ 0.50 EPS - Diluted ($ in millions, except EPS) Change (1) March 31, 2024 December 31, 2023 March 31, 2023 Q/Q Y/Y Income Statement Summary - 12.4% - 4.7% $ 57.9 $ 53.1 $ 50.7 Net interest income - 7.2% 15.8% 8.3 6.7 7.7 Noninterest income - 11.8% - 2.4% 66.2 59.8 58.4 Operating revenue 11.1% 3.5% 32.8 35.2 36.4 Noninterest expense - 89.4% - 107.9% 2.1 (2.9) 0.2 Credit loss (recovery) expense - 30.5% - 21.0% 31.3 27.5 21.7 Pretax income - 29.4% - 25.9% 9.3 8.8 6.6 Income tax expense - 31.0% - 18.6% $ 22.0 $ 18.6 $ 15.2 Net income Selected balance sheet items 3.3% - 0.1% $ 5,980 $ 6,182 $ 6,178 Loans receivable 2.8% 1.5% 6,201 6,281 6,376 Deposits 1.0% - 0.8% 7,434 7,570 7,512 Total assets 6.2% 0.2% $ 662 $ 702 $ 703 Stockholders' equity Profitability Metrics (40) (18) 1.21% 0.99% 0.81% Return on average assets (429) (180) 12.19% 9.70% 7.90% Return on average equity 46 9 8.77% 9.14% 9.23% TCE/TA (2) (50) (14) 3.28% 2.92% 2.78% Net interest margin 1,288 356 49.54% 58.86% 62.42% Efficiency ratio 32
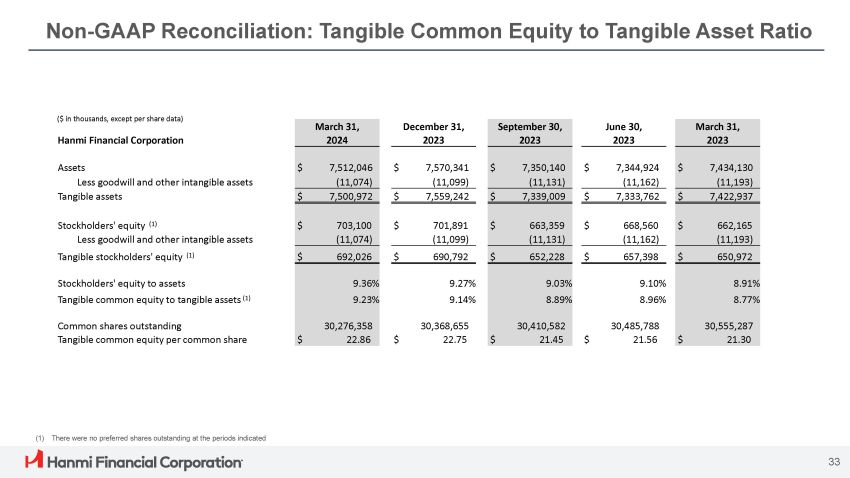
Non - GAAP Reconciliation: Tangible Common Equity to Tangible Asset Ratio 33 (1) There were no preferred shares outstanding at the periods indicated March 31, June 30, September 30, December 31, March 31, 2023 2023 2023 2023 2024 Hanmi Financial Corporation $ 7,434,130 $ 7,344,924 $ 7,350,140 $ 7,570,341 $ 7,512,046 Assets (11,193) (11,162) (11,131) (11,099) (11,074) Less goodwill and other intangible assets $ 7,422,937 $ 7,333,762 $ 7,339,009 $ 7,559,242 $ 7,500,972 Tangible assets $ 662,165 $ 668,560 $ 663,359 $ 701,891 $ 703,100 Stockholders' equity (1) (11,193) (11,162) (11,131) (11,099) (11,074) Less goodwill and other intangible assets $ 650,972 $ 657,398 $ 652,228 $ 690,792 $ 692,026 Tangible stockholders' equity (1) 8.91% 9.10% 9.03% 9.27% 9.36% Stockholders' equity to assets 8.77% 8.96% 8.89% 9.14% 9.23% Tangible common equity to tangible assets (1) 30,555,287 30,485,788 30,410,582 30,368,655 30,276,358 Common shares outstanding $ 21.30 $ 21.56 $ 21.45 $ 22.75 $ 22.86 Tangible common equity per common share ($ in thousands, except per share data)
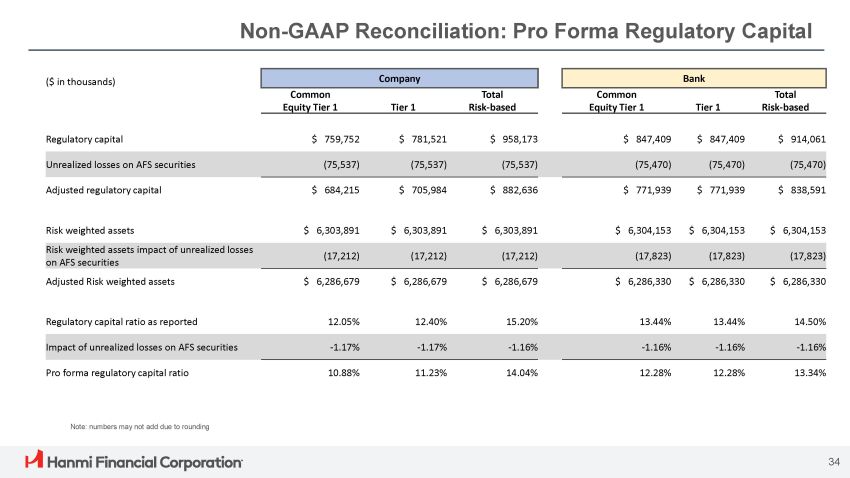
Non - GAAP Reconciliation: Pro Forma Regulatory Capital 34 Note: numbers may not add due to rounding Bank Company ($ in thousands) Total Risk - based Tier 1 Common Equity Tier 1 Total Risk - based Tier 1 Common Equity Tier 1 $ 914,061 $ 847,409 $ 847,409 $ 958,173 $ 781,521 $ 759,752 Regulatory capital (75,470) (75,470) (75,470) (75,537) (75,537) (75,537) Unrealized losses on AFS securities $ 838,591 $ 771,939 $ 771,939 $ 882,636 $ 705,984 $ 684,215 Adjusted regulatory capital $ 6,304,153 $ 6,304,153 $ 6,304,153 $ 6,303,891 $ 6,303,891 $ 6,303,891 Risk weighted assets (17,823) (17,823) (17,823) (17,212) (17,212) (17,212) Risk weighted assets impact of unrealized losses on AFS securities $ 6,286,330 $ 6,286,330 $ 6,286,330 $ 6,286,679 $ 6,286,679 $ 6,286,679 Adjusted Risk weighted assets 14.50% 13.44% 13.44% 15.20% 12.40% 12.05% Regulatory capital ratio as reported - 1.16% - 1.16% - 1.16% - 1.16% - 1.17% - 1.17% Impact of unrealized losses on AFS securities 13.34% 12.28% 12.28% 14.04% 11.23% 10.88% Pro forma regulatory capital ratio