Exhibit 99.1
California | Colorado | Georgia | Illinois | New Jersey | New York | Texas | Virginia | Washington KBW Investor Conference November 2025 NASDAQ | HAFC
2 TABLE OF CONTENTS HANMI PROFILE 5 – 20 3Q25 PERFORMANCE RESULTS 21 – 37 LOAN PORTFOLIO DETAILS 3Q25 FINANCIAL SUMMARY NON - GAAP RECONCILIATION 49 – 50 38 – 47 48 – 48
3 FORWARD - LOOKING STATEMENTS Hanmi Financial Corporation (the “Company”) cautions investors that any statements contained herein that are not historical facts are forward - looking statements within the meaning of the “safe harbor” provisions of the Private Securities Litigation Reform Act of 1995 , including, but not limited to, those statements regarding operating performance, financial position and liquidity, business strategies, regulatory, economic and competitive outlook, investment and expenditure plans, capital and financing needs and availability, litigation, plans and objectives, merger or sale activity, financial condition and results of operations, and all other forecasts and statements of expectation or assumption underlying any of the foregoing . These statements involve known and unknown risks and uncertainties that are difficult to predict . Investors should not rely on any forward - looking statement and should consider risks, such as changes in governmental policy, legislation and regulations, changes in monetary policy, economic uncertainty and changes in economic conditions, potential recessionary conditions, inflation, the effect of the imposition of tariffs and any retaliatory responses, the impact of the current federal government shutdown, including our ability to effect sales of small business administration loans, fluctuations in interest rate and credit risk, competitive pressures, our ability to access cost - effective funding, the ability to enter into new markets successfully and capitalize on growth opportunities, balance sheet management, liquidity and sources of funding, the size and composition of our deposit portfolio, including the percentage of uninsured deposits in the portfolio, increased assessments by the Federal Deposit Insurance Corporation, risk and effect of natural disasters, a failure in or breach of our operational or security systems or infrastructure, including cyberattacks, the adequacy of and changes in the economic estimates and methodology of calculating our allowance for credit losses, and other operational factors . Forward - looking statements are based upon the good faith beliefs and expectations of management as of this date only and are further subject to additional risks and uncertainties, including, but not limited to, the risk factors set forth in our earnings release dated October 21 , 2025 , including the section titled “Forward Looking Statements” and the Company’s most recent Form 10 - K, 10 - Q and other filings with the Securities and Exchange Commission . The Company disclaims any obligation to update or revise the forward - looking statements herein .
4 NON - GAAP FINANCIAL INFORMATION This presentation contains financial information determined by methods other than in accordance with accounting principles generally accepted in the United States of America (“GAAP”) . These non - GAAP measures include tangible common equity to tangible assets, tangible common equity per share (including without the impact of available for sale securities on the accumulated other comprehensive income) and pro forma regulatory capital . Management uses these “non - GAAP” measures in its analysis of the Company’s performance . Management believes these non - GAAP financial measures allow for better comparability of period to period operating performance . Additionally, the Company believes this information is utilized by regulators and market analysts to evaluate a company’s financial condition and therefore, such information is useful to investors . These disclosures should not be viewed as a substitute for operating results determined in accordance with GAAP, nor are they necessarily comparable to non - GAAP performance measures that may be presented by other companies . A reconciliation of the non - GAAP measures used in this presentation to the most directly comparable GAAP measures is provided in the Appendix to this presentation .
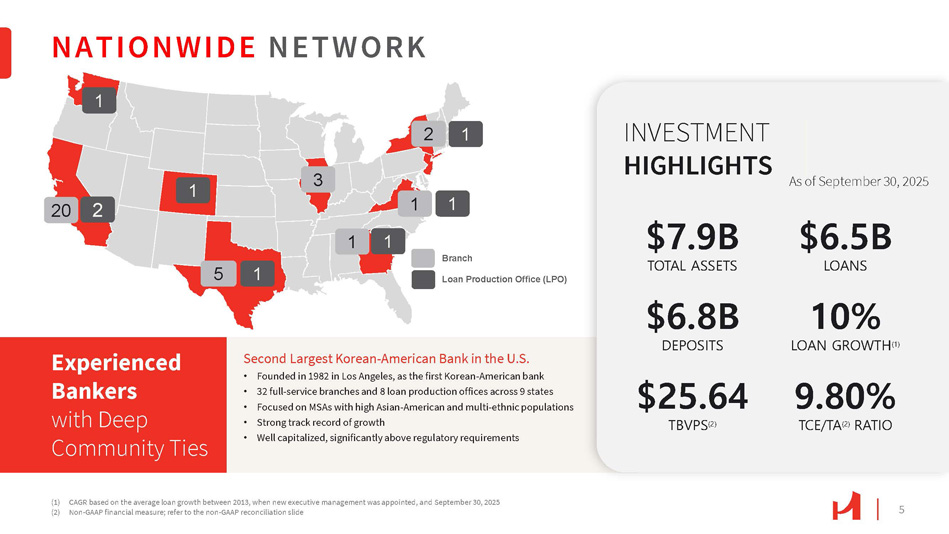
Second Largest Korean - American Bank in the U.S. • Founded in 1982 in Los Angeles, as the first Korean - American bank • 32 full - service branches and 8 loan production offices across 9 states • Focused on MSAs with high Asian - American and multi - ethnic populations • Strong track record of growth • Well capitalized, significantly above regulatory requirements Experienced Bankers with Deep Community Ties 3 1 1 1 1 5 1 NATIONWIDE NETWORK 1 2 Branch Loan Production Office (LPO) 1 20 2 TOTAL ASSETS $6.5B LOANS $6.8B DEPOSITS 10% LOAN GROWTH (1) 9.80% TCE/TA (2) RATIO $25.64 TBVPS (2) INVESTMENT HIGHLIGHTS $7.9B As of September 30, 2025 (1) CAGR based on the average loan growth between 2013, when new executive management was appointed, and September 30, 2025 (2) Non - GAAP financial measure; refer to the non - GAAP reconciliation slide 5 1
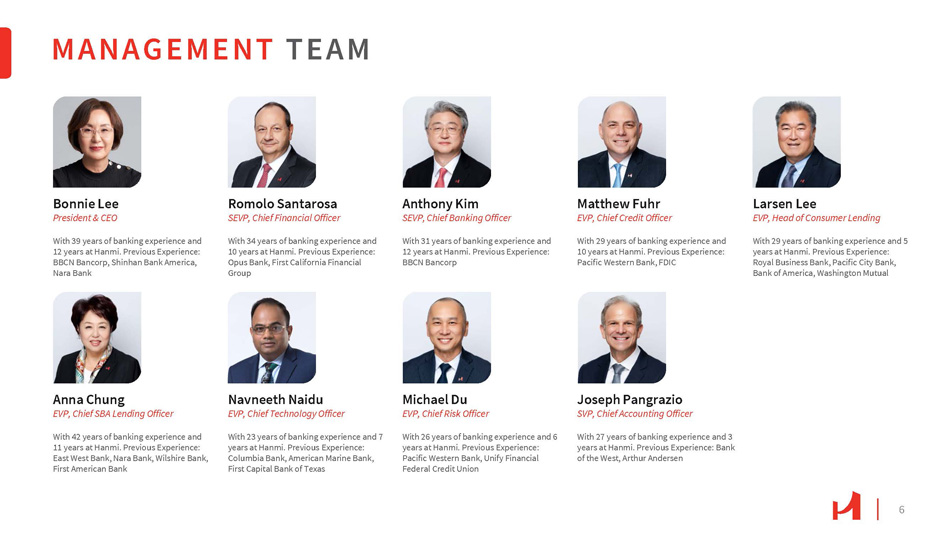
MANAGEMENT TEAM 6 Bonnie Lee President & CEO With 39 years of banking experience and 12 years at Hanmi. Previous Experience: BBCN Bancorp, Shinhan Bank America, Nara Bank Romolo Santarosa SEVP, Chief Financial Officer With 34 years of banking experience and 10 years at Hanmi. Previous Experience: Opus Bank, First California Financial Group Anthony Kim SEVP, Chief Banking Officer With 31 years of banking experience and 12 years at Hanmi . Previous Experience : BBCN Bancorp Matthew Fuhr EVP, Chief Credit Officer With 29 years of banking experience and 10 years at Hanmi . Previous Experience : Pacific Western Bank, FDIC Larsen Lee EVP, Head of Consumer Lending With 29 years of banking experience and 5 years at Hanmi. Previous Experience: Royal Business Bank, Pacific City Bank, Bank of America, Washington Mutual Anna Chung EVP, Chief SBA Lending Officer With 42 years of banking experience and 11 years at Hanmi. Previous Experience: East West Bank, Nara Bank, Wilshire Bank, First American Bank Navneeth Naidu EVP, Chief Technology Officer With 23 years of banking experience and 7 years at Hanmi. Previous Experience: Columbia Bank, American Marine Bank, First Capital Bank of Texas Michael Du EVP, Chief Risk Officer With 26 years of banking experience and 6 years at Hanmi. Previous Experience: Pacific Western Bank, Unify Financial Federal Credit Union Joseph Pangrazio SVP, Chief Accounting Officer With 27 years of banking experience and 3 years at Hanmi . Previous Experience : Bank of the West, Arthur Andersen
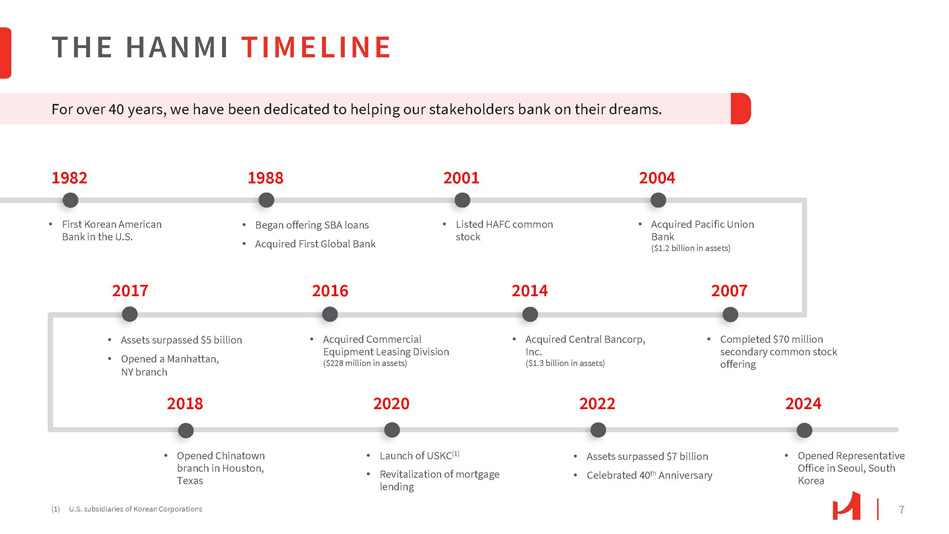
• Acquired Central Bancorp, Inc. ($1.3 billion in assets) THE HANMI TIMELINE 7 (1) U.S. subsidiaries of Korean Corporations • First Korean American Bank in the U.S. • Began offering SBA loans • Acquired First Global Bank • Listed HAFC common stock • Acquired Pacific Union Bank ($1.2 billion in assets) • Completed $70 million secondary common stock offering • Acquired Commercial Equipment Leasing Division ($228 million in assets) • Assets surpassed $5 billion • Opened a Manhattan, NY branch • Assets surpassed $7 billion • Celebrated 40 th Anniversary • Launch of USKC (1) • Revitalization of mortgage lending • Opened Chinatown branch in Houston, Texas • Opened Representative Office in Seoul, South Korea 1982 1988 2001 2004 2007 2014 2016 2017 2018 2020 2022 2024 For over 40 years, we have been dedicated to helping our stakeholders bank on their dreams.
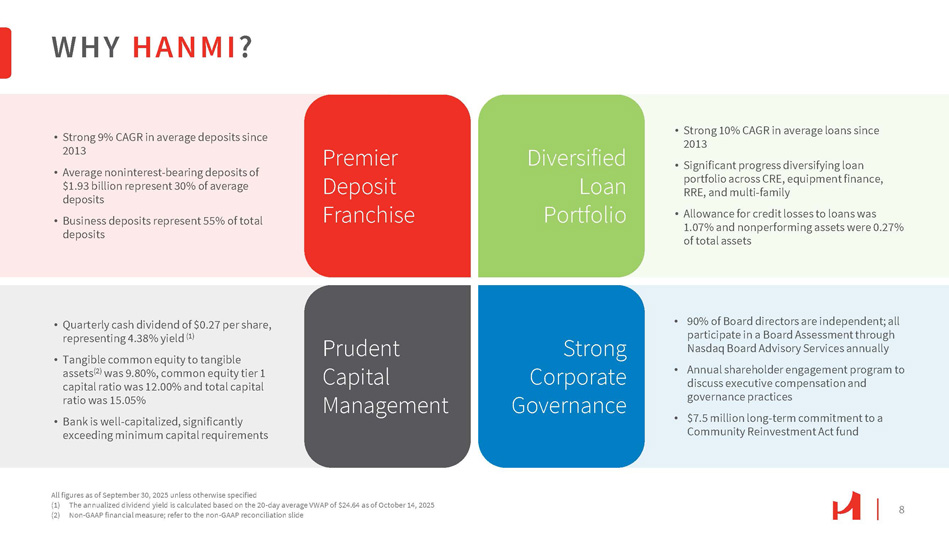
WHY HANMI ? 8 • Strong 10% CAGR in average loans since 2013 • Significant progress diversifying loan portfolio across CRE, equipment finance, RRE, and multi - family • Allowance for credit losses to loans was 1.07% and nonperforming assets were 0.27% of total assets • Strong 9% CAGR in average deposits since 2013 • Average noninterest - bearing deposits of $1.93 billion represent 30% of average deposits • Business deposits represent 55% of total deposits • Quarterly cash dividend of $0.27 per share, representing 4.38% yield (1) • Tangible common equity to tangible assets (2) was 9.80%, common equity tier 1 capital ratio was 12.00% and total capital ratio was 15.05% • Bank is well - capitalized, significantly exceeding minimum capital requirements • 90% of Board directors are independent; all participate in a Board Assessment through Nasdaq Board Advisory Services annually • Annual shareholder engagement program to discuss executive compensation and governance practices • $7.5 million long - term commitment to a Community Reinvestment Act fund All figures as of September 30, 2025 unless otherwise specified (1) The annualized dividend yield is calculated based on the 20 - day average VWAP of $24.64 as of October 14, 2025 (2) Non - GAAP financial measure; refer to the non - GAAP reconciliation slide Prudent Capital Management Diversified Loan Portfolio Premier Deposit Franchise Strong Corporate Governance
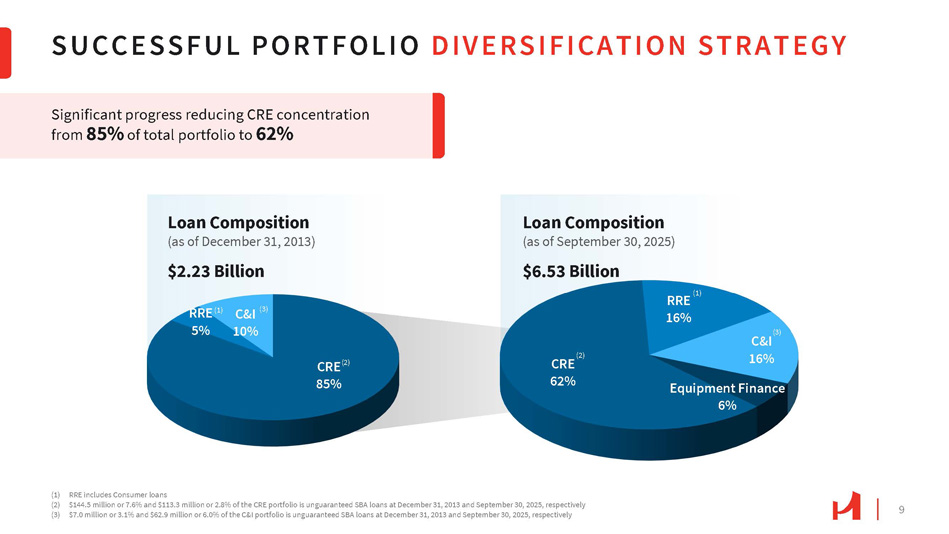
RRE (1) 5% CRE (2) 85% C&I (3) 10% Equipment Finance 6% (2) CRE 62% (3) C&I 16% Loan Composition (as of December 31, 2013) $2.23 Billion Loan Composition (as of September 30, 2025) $6.53 Billion RRE (1) 16% SUCCESSFUL PORTFOLIO DIVERSIFICATION STRATEGY Significant progress reducing CRE concentration from 85% of total portfolio to 62% (1) RRE includes Consumer loans (2) $144.5 million or 7.6% and $113.3 million or 2.8% of the CRE portfolio is unguaranteed SBA loans at December 31, 2013 and September 30, 2025, respectively (3) $7.0 million or 3.1% and $62.9 million or 6.0% of the C&I portfolio is unguaranteed SBA loans at December 31, 2013 and September 30, 2025, respectively 9
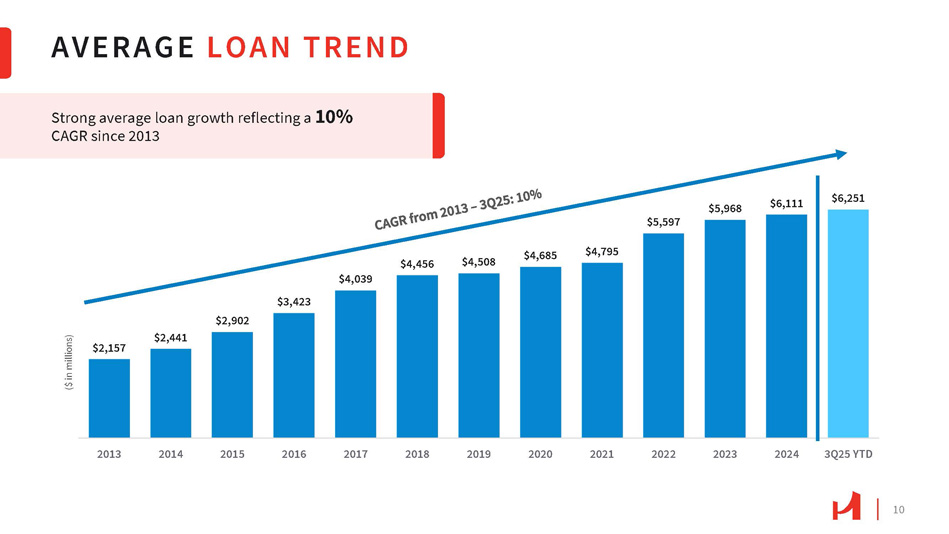
$2,902 $2,441 $2,157 $4,039 $3,423 $4,456 $4,508 $4,685 $4,795 $5,597 $5,968 $6,111 $6,251 2013 2014 2015 2016 2017 2018 2019 2020 2021 2022 2023 2024 3Q25 YTD AVERAGE LOAN TREND ($ in millions) 10 Strong average loan growth reflecting a 10% CAGR since 2013
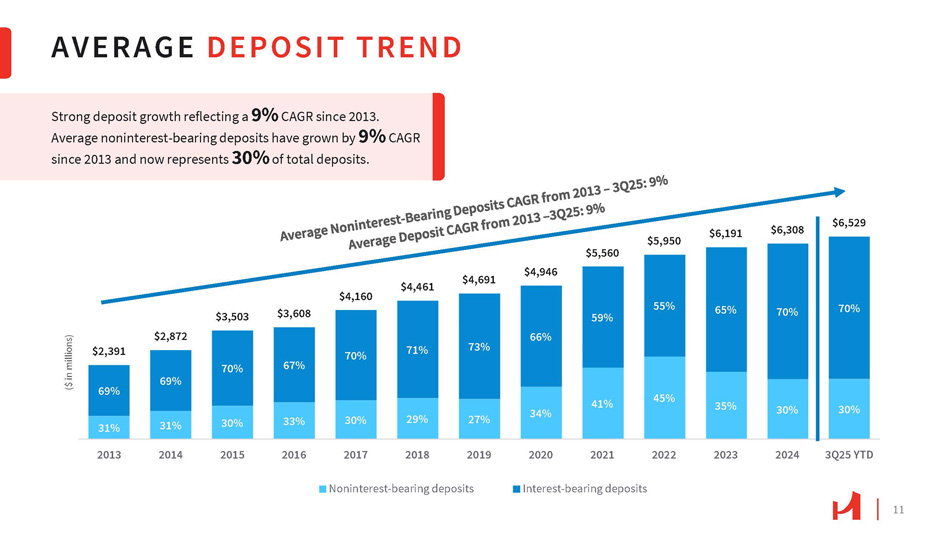
59% 55% 65% 70% 70% $3,503 $3,608 $4,160 $4,461 $4,691 $4,946 $5,560 $5,950 $6,191 $6,308 $6,529 66% 73% 71% 70% 67% 70% $2,872 $2,391 30% 30% 35% 45% 41% 34% 27% 29% 30% 33% 30% 69% 31% 69% 31% 3Q25 YTD 2024 2023 2022 2021 2020 2019 2018 2017 2016 2015 2014 2013 Noninterest - bearing deposits Interest - bearing deposits AVERAGE DEPOSIT TREND ($ in millions) Strong deposit growth reflecting a 9% CAGR since 2013. Average noninterest - bearing deposits have grown by 9% CAGR since 2013 and now represents 30% of total deposits. 11
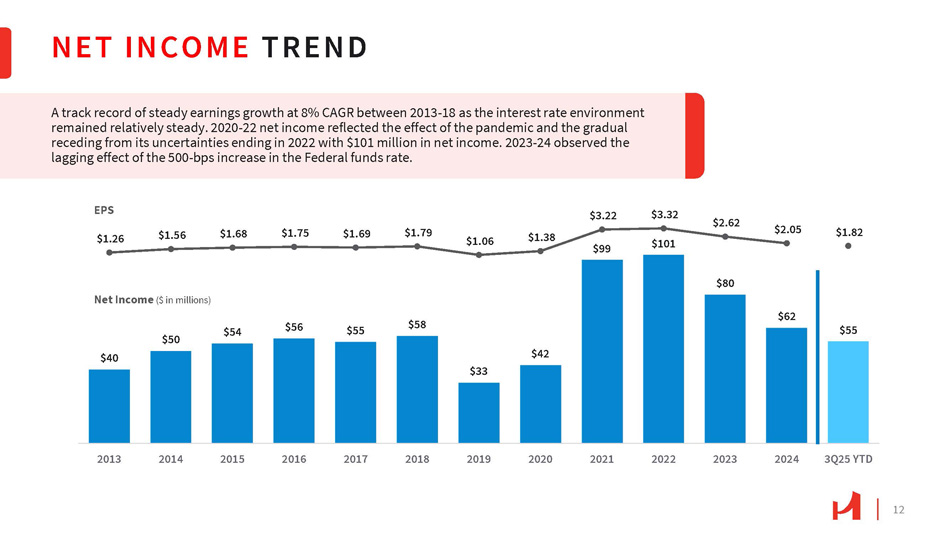
$40 $50 $54 $56 $55 $58 $33 $42 $99 $101 $80 $62 $55 $1.26 $1.56 $1.68 $1.75 $1.69 $1.79 $1.06 $1.38 $3.22 $3.32 $2.62 $2.05 $1.82 2013 2014 2015 2016 2017 2018 2019 2020 2021 2022 2023 2024 3Q25 YTD NET INCOME TREND 12 EPS Net Income ($ in millions) A track record of steady earnings growth at 8% CAGR between 2013 - 18 as the interest rate environment remained relatively steady. 2020 - 22 net income reflected the effect of the pandemic and the gradual receding from its uncertainties ending in 2022 with $101 million in net income. 2023 - 24 observed the lagging effect of the 500 - bps increase in the Federal funds rate.
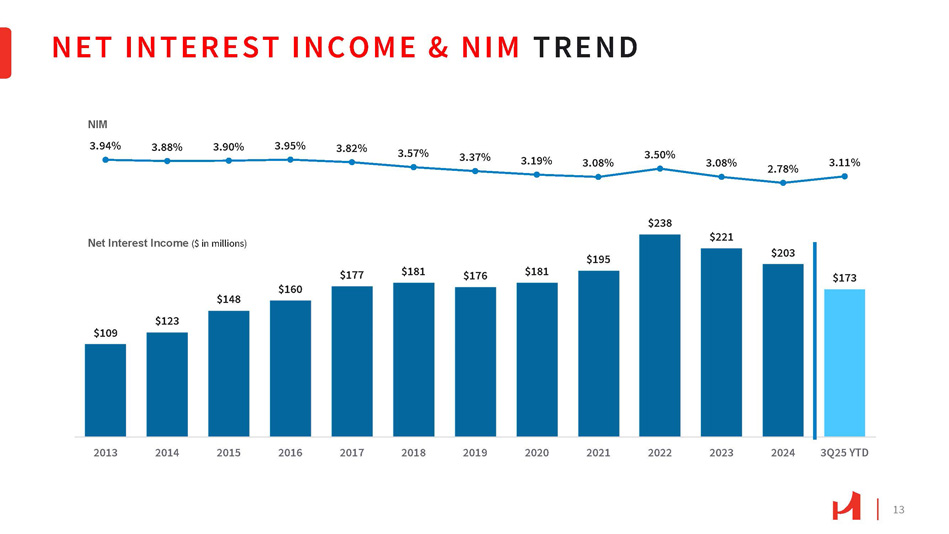
NET INTEREST INCOME & NIM TREND 13 NIM 3.94% Net Interest Income ($ in millions) $160 $148 $123 $109 $177 $181 $176 $181 $195 $238 $221 $203 $173 3.88% 3.90% 3.95% 3.82% 3.57% 3.37% 3.19% 3.08% 3.50% 3.08% 2.78% 3.11% 2013 2014 2015 2016 2017 2018 2019 2020 2021 2022 2023 2024 3Q25 YTD
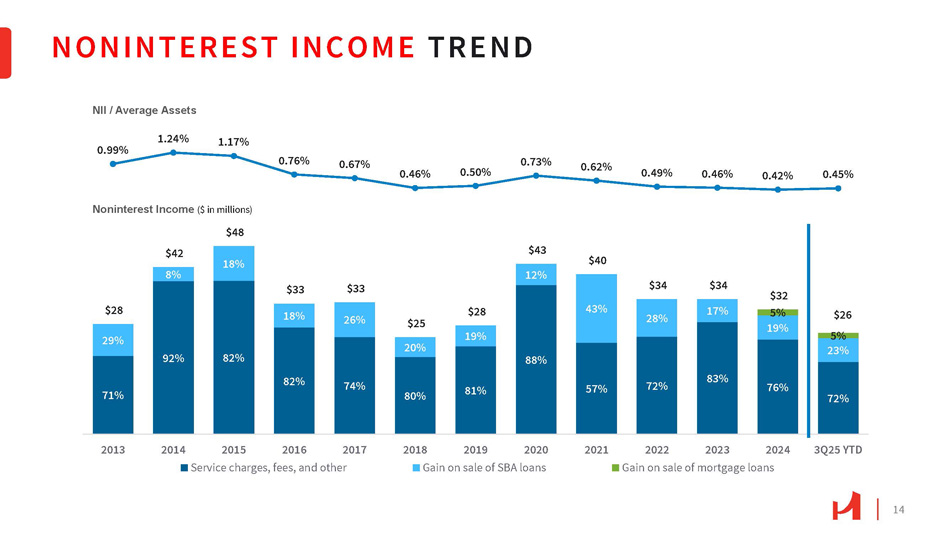
NONINTEREST INCOME TREND 14 NII / Average Assets 71% 92% 82% 82% 74% 80% 81% 88% 57% 72% 83% 76% 72% 29% 8% 18% 18% 26% 20% 19% 12% 43% 28% 17% 19% 23% 5% $28 $42 Noninterest Income ($ in millions) $48 $33 $33 $25 $28 $43 $40 $34 $34 $32 $26 5% 0.99% 1.24% 1.17% 0.76% 0.67% 0.46% 0.50% 0.73% 0.62% 0.49% 0.46% 0.42% 0.45% 2013 2014 2015 2016 2017 Service charges, fees, and other 2021 2022 2023 2024 3Q25 YTD Gain on sale of mortgage loans 2018 2019 2020 Gain on sale of SBA loans
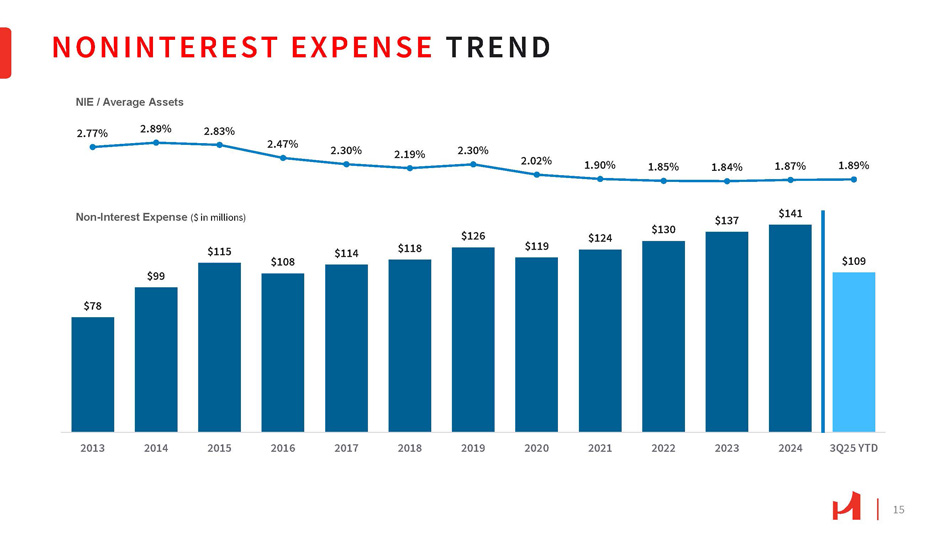
NONINTEREST EXPENSE TREND 15 NIE / Average Assets Non - Interest Expense ($ in millions) $99 $78 $115 $108 $114 $118 $126 $119 $124 $130 $137 $141 $109 2.77% 2.89% 2.83% 2.47% 2.30% 2.19% 2.30% 2.02% 1.90% 1.85% 1.84% 1.87% 1.89% 2013 2014 2015 2016 2017 2018 2019 2020 2021 2022 2023 2024 3Q25 YTD
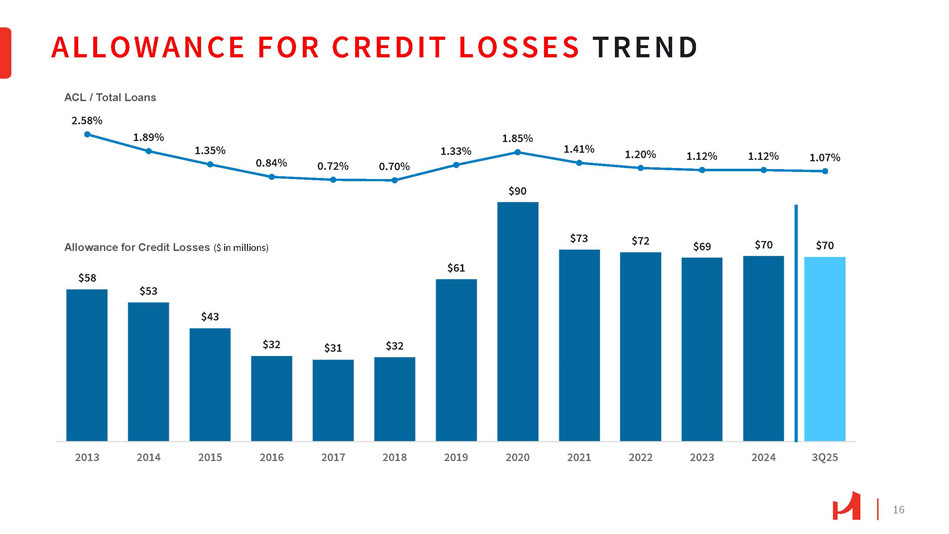
ALLOWANCE FOR CREDIT LOSSES TREND 16 Allowance for Credit Losses ($ in millions) $58 $53 $43 $32 $31 $32 $61 $90 $73 $72 $69 $70 $70 0.84% 0.72% 0.70% 1.35% 1.33% ACL / Total Loans 2.58% 1.89% 1.85% 1.41% 1.20% 1.12% 1.12% 1.07% 2013 2014 2015 2016 2017 2018 2019 2020 2021 2022 2023 2024 3Q25
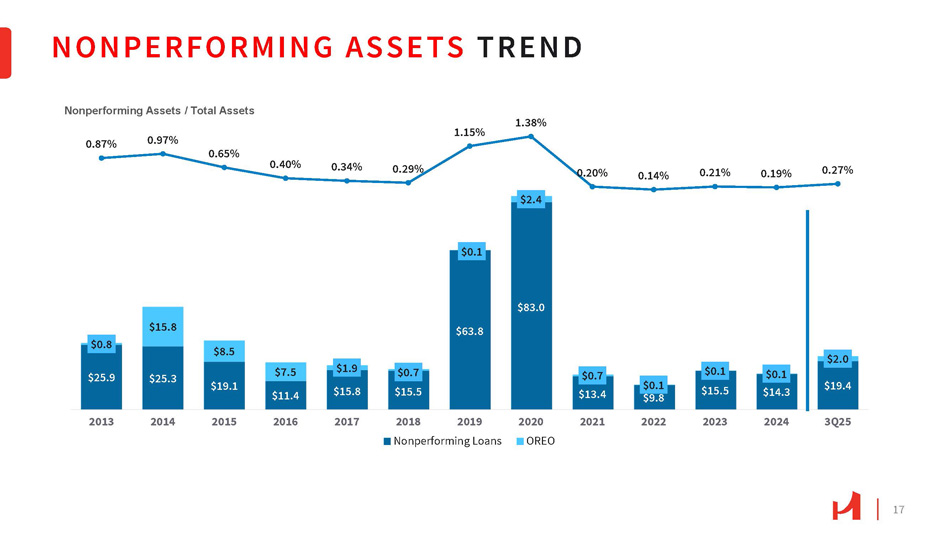
NONPERFORMING ASSETS TREND 17 NPAs/Total Assets Nonperforming Assets ($ in millions) $63.8 $83.0 $9.8 $15.8 $0.1 $2.4 0.87% 0.97% 0.65% 0.40% 0.34% 0.29% 1.15% 1.38% 0.20% 0.14% 0.21% 0.19% 0.27% $2.0 $0.1 $0.1 $15.5 $14.3 $19.4 $0.1 $0.7 $13.4 $0.7 $15.5 $1.9 $15.8 $7.5 $11.4 $0.8 $8.5 $25.9 $25.3 $19.1 3Q25 2024 2023 2022 2021 2020 2019 2018 2017 2016 2015 2014 2013 Nonperforming Loans OREO Nonperforming Assets / Total Assets
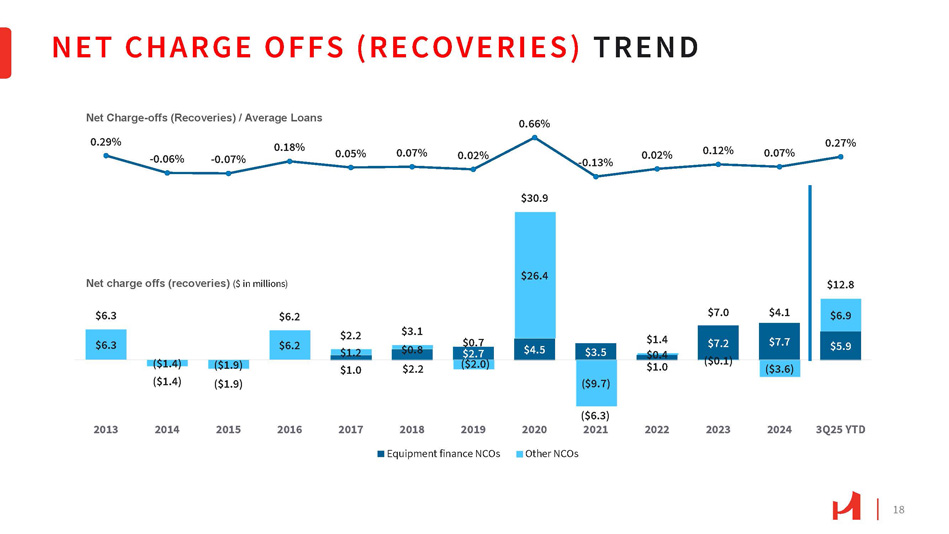
NET CHARGE OFFS ( RECOVERIES) TREND 18 Net Charge - offs (Recoveries) / Average Loans $1.0 $2.2 $2.7 $4.5 $3.5 $7.7 $5.9 ($1.4) ($2.0) $26.4 ($9.7) $7.2 ($0.1) ($3.6) $6.9 ($1.4) ($1.9) ($1.9) Net charge offs (recoveries) ($ in millions) $6.3 $6.2 $6.3 $6.2 $2.2 $1.2 $3.1 $0.8 $0.7 $30.9 $1.4 $0.4 $1.0 ($6.3) 2021 $7.0 $4.1 $12.8 0.29% - 0.06% - 0.07% 0.18% 0.05% 0.07% 0.02% 0.66% - 0.13% 0.02% 0.12% 0.07% 0.27% 2013 2014 2015 2016 2017 2018 2019 Equipment finance NCOs 2022 2023 2024 3Q25 YTD 2020 Other NCOs
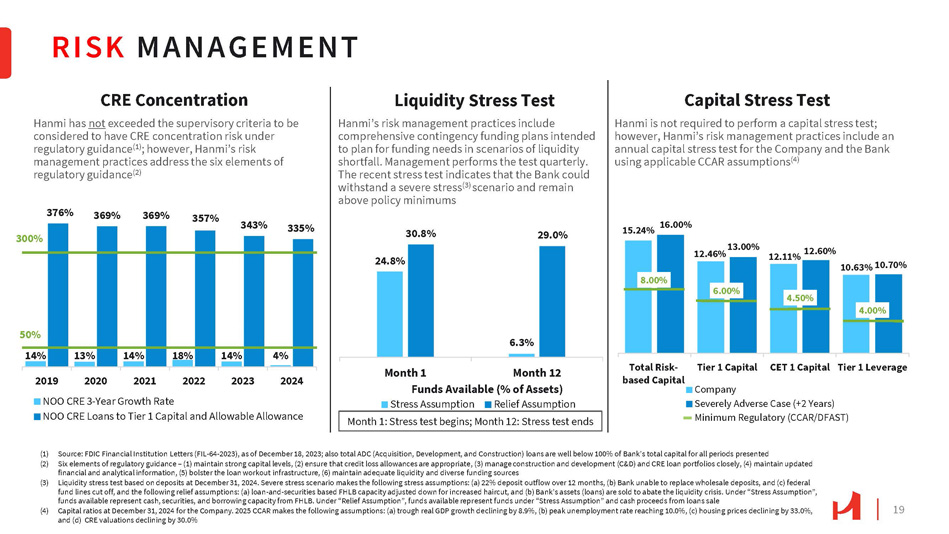
RISK MANAGEMENT 19 CRE Concentration Hanmi has not exceeded the supervisory criteria to be considered to have CRE concentration risk under regulatory guidance (1) ; however, Hanmi’s risk management practices address the six elements of regulatory guidance (2) 14% 13% 14% 18% 14% 4% 376% 369% 369% 357% 343% 335% 300% 50% 2019 2020 2021 2022 2023 2024 NOO CRE 3 - Year Growth Rate NOO CRE Loans to Tier 1 Capital and Allowable Allowance (1) Source: FDIC Financial Institution Letters (FIL - 64 - 2023), as of December 18, 2023; also total ADC (Acquisition, Development, and Construction) loans are well below 100% of Bank’s total capital for all periods presented (2) Six elements of regulatory guidance – (1) maintain strong capital levels, (2) ensure that credit loss allowances are appropriate, (3) manage construction and development (C&D) and CRE loan portfolios closely, (4) maintain updated financial and analytical information, (5) bolster the loan workout infrastructure, (6) maintain adequate liquidity and diverse funding sources (3) Liquidity stress test based on deposits at December 31, 2024. Severe stress scenario makes the following stress assumptions: (a) 22% deposit outflow over 12 months, (b) Bank unable to replace wholesale deposits, and (c) federal fund lines cut off, and the following relief assumptions: (a) loan - and - securities based FHLB capacity adjusted down for increased haircut, and (b) Bank’s assets (loans) are sold to abate the liquidity crisis. Under “Stress Assumption”, funds available represent cash, securities, and borrowing capacity from FHLB. Under “Relief Assumption”, funds available represent funds under “Stress Assumption” and cash proceeds from loans sale (4) Capital ratios at December 31, 2024 for the Company. 2025 CCAR makes the following assumptions: (a) trough real GDP growth declining by 8.9%, (b) peak unemployment rate reaching 10.0%, (c) housing prices declining by 33.0%, and (d) CRE valuations declining by 30.0% Liquidity Stress Test Hanmi’s risk management practices include comprehensive contingency funding plans intended to plan for funding needs in scenarios of liquidity shortfall. Management performs the test quarterly. The recent stress test indicates that the Bank could withstand a severe stress (3) scenario and remain above policy minimums 24.8% 6.3% 30.8% 29.0% Month 1 Month 12 Funds Available (% of Assets) Stress Assumption Relief Assumption Capital Stress Test Hanmi is not required to perform a capital stress test; however, Hanmi’s risk management practices include an annual capital stress test for the Company and the Bank using applicable CCAR assumptions (4) 15.24% 12.46% 13.00% 12.11% 12.60% 10.63% 10.70% 16.00% 8.00% 6.00% 4.50% 4.00% Total Risk - based Capital Tier 1 Capital Company CET 1 Capital Tier 1 Leverage Severely Adverse Case (+2 Years) Minimum Regulatory (CCAR/DFAST) Month 1: Stress test begins; Month 12: Stress test ends
CORPORATE GOVERNANCE 20 Oversight Hanmi is committed to sound corporate governance principles and maintains formal Corporate Governance Guidelines and a Code of Business Conduct and Ethics for employees, executive officers, and directors . Nominating and Corporate Governance (NCG) Committee NCG Committee identifies individuals qualified to become directors, and has oversight over corporate governance principles applicable to Hanmi. ESG sub - committee, within NCG Committee, has the primary oversight of corporate citizenship and ESG - related matters. Risk, Compliance and Planning (RCP) Committee The RCP Committee provides oversight of the enterprise risk management framework, and also oversees the strategic planning and the budgetary function. Audit Committee The Audit Committee is responsible for overseeing and monitoring financial accounting and reporting, the system of internal controls established by management, and our audit process and policies. Compensation and Human Resources (CHR) Committee The CHR Committee oversees the compensation of Hanmi’s executive officers and administers Hanmi’s compensation plans. Governance and management of environmental and social impact create long - term value for our stakeholders. Our Board The NCG Committee believes the Board should encompass a broad range of talent, skill, knowledge, experience, diversity, and expertise. Our board is currently comprised of eleven directors, four of whom are female and seven of whom are of Asian descent. We believe the diverse composition of our board is a competitive advantage. The knowledge, experience and viewpoints espoused by our directors lead to more meaningful, strategic decisions and leads to meaningful and innovative discussions to better serve our stakeholders. Shareholder Engagement • Annual shareholder engagement program to discuss executive compensation and governance practices • Ethics Hotline that allows for confidential reporting of any suspected concerns or improper conduct Source: 2025 Proxy Statement
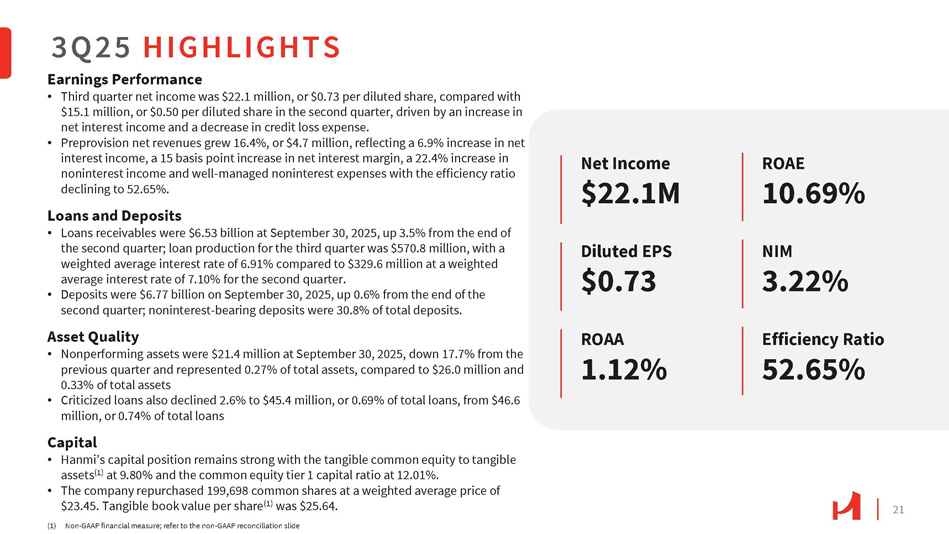
21 Earnings Performance • Third quarter net income was $22.1 million, or $0.73 per diluted share, compared with $15.1 million, or $0.50 per diluted share in the second quarter, driven by an increase in net interest income and a decrease in credit loss expense. • Preprovision net revenues grew 16.4%, or $4.7 million, reflecting a 6.9% increase in net interest income, a 15 basis point increase in net interest margin, a 22.4% increase in noninterest income and well - managed noninterest expenses with the efficiency ratio declining to 52.65%. Loans and Deposits • Loans receivables were $6.53 billion at September 30, 2025, up 3.5% from the end of the second quarter; loan production for the third quarter was $570.8 million, with a weighted average interest rate of 6.91% compared to $329.6 million at a weighted average interest rate of 7.10% for the second quarter. • Deposits were $6.77 billion on September 30, 2025, up 0.6% from the end of the second quarter; noninterest - bearing deposits were 30.8% of total deposits. Asset Quality • Nonperforming assets were $ 21 . 4 million at September 30 , 2025 , down 17 . 7 % from the previous quarter and represented 0 . 27 % of total assets, compared to $ 26 . 0 million and 0 . 33 % of total assets • Criticized loans also declined 2 . 6 % to $ 45 . 4 million, or 0 . 69 % of total loans, from $ 46 . 6 million, or 0 . 74 % of total loans Capital • Hanmi’s capital position remains strong with the tangible common equity to tangible assets (1) at 9.80% and the common equity tier 1 capital ratio at 12.01%. • The company repurchased 199,698 common shares at a weighted average price of $23.45. Tangible book value per share (1) was $25.64. (1) Non - GAAP financial measure; refer to the non - GAAP reconciliation slide Net Income $22.1M Diluted EPS $0.73 ROAA 1.12% ROAE 10.69% NIM 3.22% Efficiency Ratio 52.65% 3Q25 HIGHLIGHTS
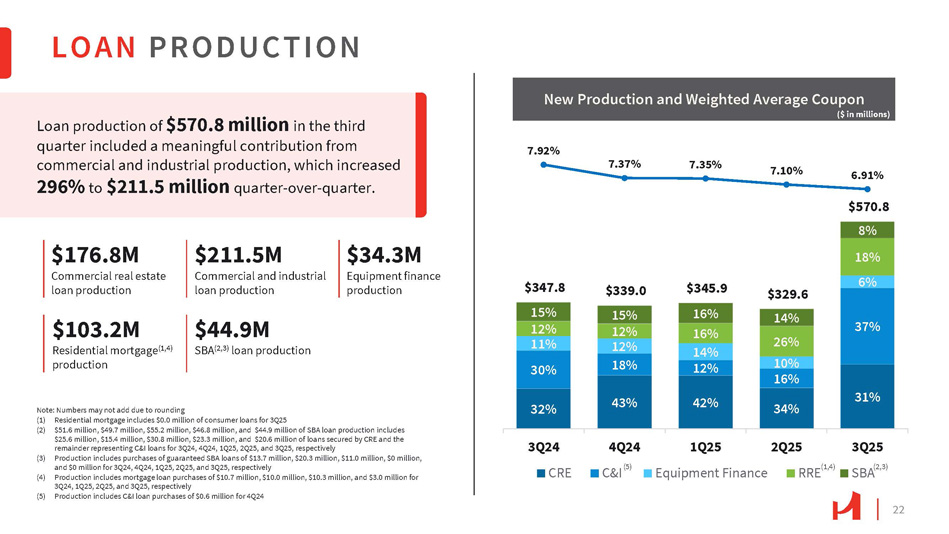
LOAN PRODUCTION 22 Loan production of $570.8 million in the third quarter included a meaningful contribution from commercial and industrial production, which increased 296% to $211.5 million quarter - over - quarter. Note: Numbers may not add due to rounding (1) Residential mortgage includes $0.0 million of consumer loans for 3Q25 (2) $51.6 million, $49.7 million, $55.2 million, $46.8 million, and $44.9 million of SBA loan production includes $25.6 million, $15.4 million, $30.8 million, $23.3 million, and $20.6 million of loans secured by CRE and the remainder representing C&I loans for 3Q24, 4Q24, 1Q25, 2Q25, and 3Q25, respectively (3) Production includes purchases of guaranteed SBA loans of $13.7 million, $20.3 million, $11.0 million, $0 million, and $0 million for 3Q24, 4Q24, 1Q25, 2Q25, and 3Q25, respectively (4) Production includes mortgage loan purchases of $10.7 million, $10.0 million, $10.3 million, and $3.0 million for 3Q24, 1Q25, 2Q25, and 3Q25, respectively (5) Production includes C&I loan purchases of $0.6 million for 4Q24 $176.8M Commercial real estate loan production $211.5M Commercial and industrial loan production $34.3M Equipment finance production $103.2M Residential mortgage (1,4) production $44.9M SBA (2,3) loan production 32% 43% 42% 31% 37% 6% $347.8 15% 12% 11% 30% $339.0 15% 12% 12% 18% $345.9 16% 16% 14% 12% $329.6 14% 26% 10% 16% 34% $570.8 8% 18% 7.92% 7.37% 7.35% 7.10% 6.91% 4Q24 C&I (5) 3Q25 SBA (2,3) 3Q24 CRE 1Q25 Equipment Finance 2Q25 RRE (1,4) New Production and Weighted Average Coupon ($ in millions)
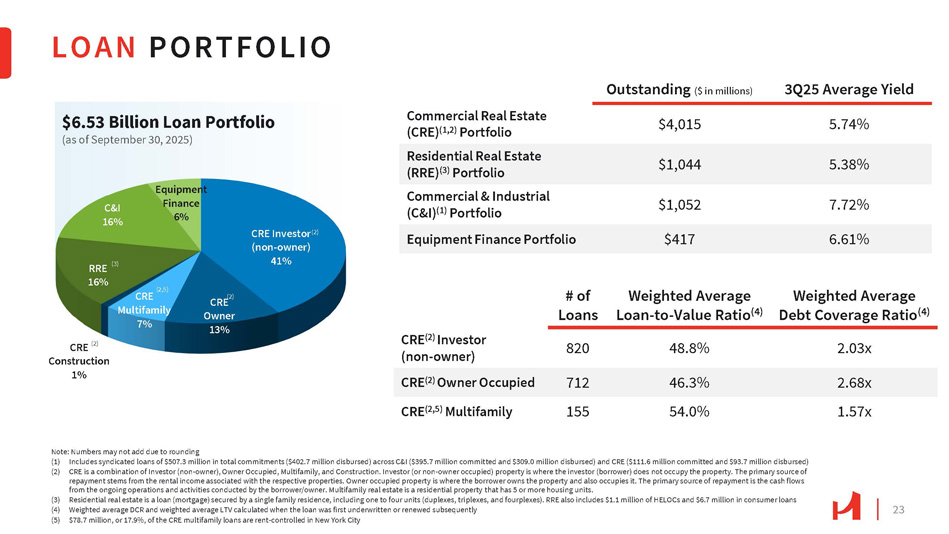
CRE Multifamily 7% 16% C&I 16% Equipment Finance 6% CRE (2) Construction 1% (2,5) CRE (2) Owner 13% CRE Investor (2) (non - owner) 41% RRE (3) $6.53 Billion Loan Portfolio (as of September 30, 2025) LOAN PORTFOLIO 23 Note: Numbers may not add due to rounding (1) Includes syndicated loans of $507.3 million in total commitments ($402.7 million disbursed) across C&I ($395.7 million committed and $309.0 million disbursed) and CRE ($111.6 million committed and $93.7 million disbursed) (2) CRE is a combination of Investor (non - owner), Owner Occupied, Multifamily, and Construction. Investor (or non - owner occupied) property is where the investor (borrower) does not occupy the property. The primary source of repayment stems from the rental income associated with the respective properties. Owner occupied property is where the borrower owns the property and also occupies it. The primary source of repayment is the cash flows from the ongoing operations and activities conducted by the borrower/owner. Multifamily real estate is a residential property that has 5 or more housing units. (3) Residential real estate is a loan (mortgage) secured by a single family residence, including one to four units (duplexes, triplexes, and fourplexes). RRE also includes $1.1 million of HELOCs and $6.7 million in consumer loans (4) Weighted average DCR and weighted average LTV calculated when the loan was first underwritten or renewed subsequently (5) $78.7 million, or 17.9%, of the CRE multifamily loans are rent - controlled in New York City 3Q25 Average Yield Outstanding ($ in millions) 5.74% $4,015 Commercial Real Estate (CRE) (1,2) Portfolio 5.38% $1,044 Residential Real Estate (RRE) (3) Portfolio 7.72% $1,052 Commercial & Industrial (C&I) (1) Portfolio 6.61% $417 Equipment Finance Portfolio Weighted Average Debt Coverage Ratio (4) Weighted Average Loan - to - Value Ratio (4) # of Loans 2.03x 48.8% 820 CRE (2) Investor (non - owner) 2.68x 46.3% 712 CRE (2) Owner Occupied 1.57x 54.0% 155 CRE (2,5) Multifamily
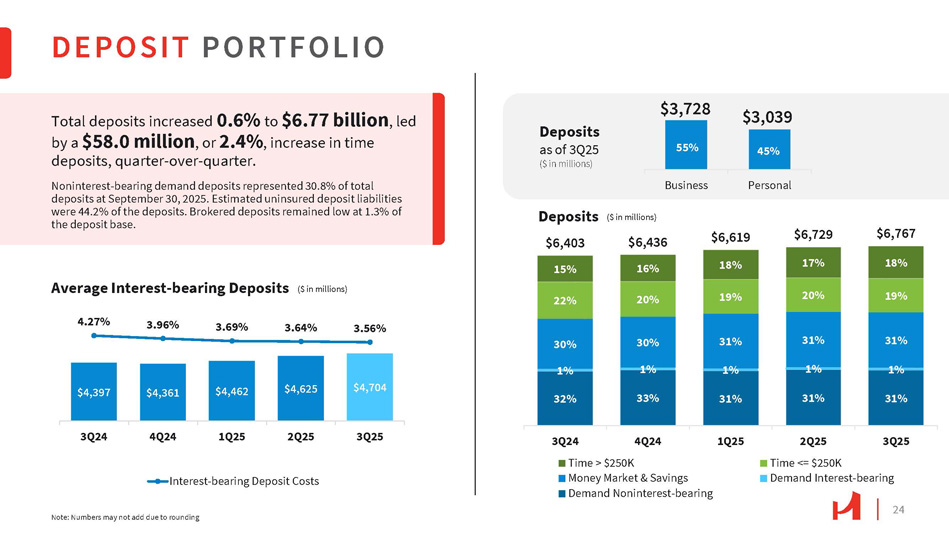
$4,704 $4,625 $4,462 $4,361 $4,397 3Q25 2Q25 1Q25 4Q24 3Q24 4.27% 3.96% 3.69% 3.64% 3.56% Interest - bearing Deposit Costs Average Interest - bearing Deposits DEPOSIT PORTFOLIO Total deposits increased 0.6% to $6.77 billion , led by a $58.0 million , or 2.4% , increase in time deposits, quarter - over - quarter. Noninterest - bearing demand deposits represented 30.8% of total deposits at September 30, 2025. Estimated uninsured deposit liabilities were 44.2% of the deposits. Brokered deposits remained low at 1.3% of the deposit base. Note: Numbers may not add due to rounding Deposits $6,436 $6,403 16% 15% 20% 22% $6,767 $6,729 $6,619 18% 17% 18% 19% 20% 19% 31% 31% 31% 30% 30% 1% 1% 1% 1% 1% 31% 31% 31% 33% 32% 3Q25 2Q25 Time <= $250K 1Q25 4Q24 3Q24 Time > $250K Demand Interest - bearing Money Market & Savings Demand Noninterest - bearing ($ in millions) Deposits as of 3Q25 ($ in millions) $3,728 Business Personal $3,039 45% 24 55% ($ in millions)
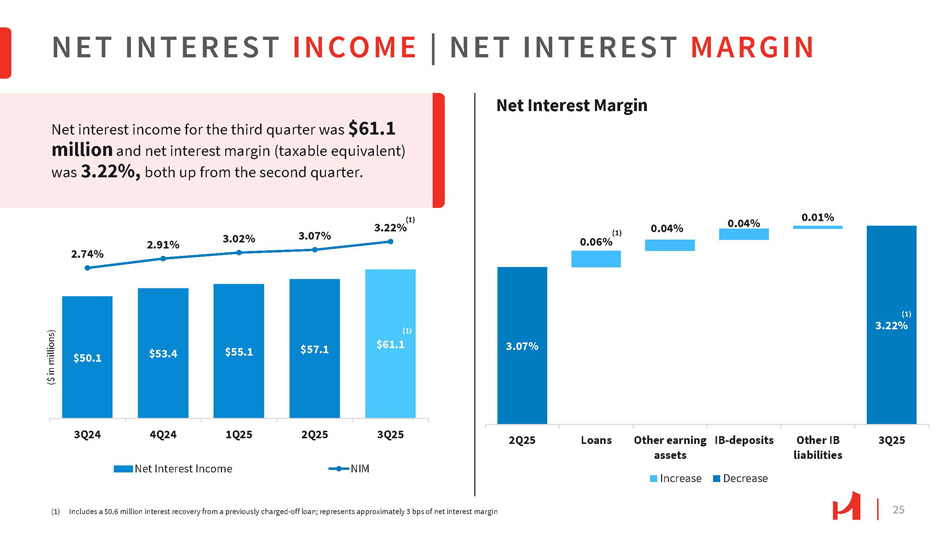
25 $50.1 $53.4 $55.1 $57.1 2.74% 2.91% 3.02% 3.07% 3.22% 3Q24 4Q24 1Q25 Net Interest Income 2Q25 3Q25 NIM NET INTEREST INCOME | NET INTEREST MARGIN ($ in millions) (1) $61.1 3.07% (1) 3.22% 0.06% 0.04% 0.04% 0.01% 2Q25 Loans Other IB liabilities 3Q25 Other earning IB - deposits assets Increase Decrease Net interest income for the third quarter was $61.1 million and net interest margin (taxable equivalent) was 3.22%, both up from the second quarter. Net Interest Margin (1) Includes a $0.6 million interest recovery from a previously charged - off loan; represents approximately 3 bps of net interest margin (1) (1)
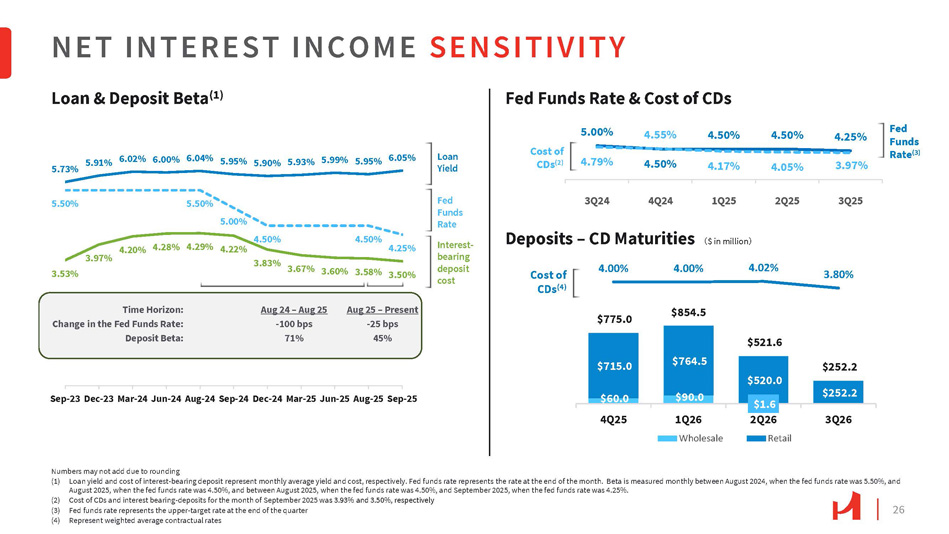
26 5.73% 5.91% 6.02% 6.00% 6.04% 5.95% 5.90% 5.93% 5.99% 5.95% 6.05% 3.53% 3.97% 5.50% 5.50% 5.00% 4.50% 4.20% 4.28% 4.29% 4.22% 3.83% 4.50% 4.25% 3.67% 3.60% 3.58% 3.50% Sep - 23 Dec - 23 Mar - 24 Jun - 24 Aug - 24 Sep - 24 Dec - 24 Mar - 25 Jun - 25 Aug - 25 Sep - 25 NET INTEREST INCOME SENSITIVITY $60.0 $90.0 $1.6 $715.0 $764.5 $520.0 $775.0 $854.5 $521.6 $252.2 $252.2 4.00% 4.00% 4.02% 3.80% 4Q25 3Q26 1Q26 Wholesale 2Q26 Retail 5.00% 4.50% 4.55% 4.50% 4.50% 4.25% 4.79% 4.17% 4.05% 3.97% 3Q24 4Q24 1Q25 Deposits – CD Maturities 㸦 $ in million 㸧 2Q25 3Q25 Fed Funds Rate (3) Cost of CDs (4) Numbers may not add due to rounding (1) Loan yield and cost of interest - bearing deposit represent monthly average yield and cost, respectively. Fed funds rate represents the rate at the end of the month. Beta is measured monthly between August 2024, when the fed funds rate was 5.50%, and August 2025, when the fed funds rate was 4.50%, and between August 2025, when the fed funds rate was 4.50%, and September 2025, when the fed funds rate was 4.25%. (2) Cost of CDs and interest bearing - deposits for the month of September 2025 wa s 3.93% and 3.50%, respectively (3) Fed funds rate represents the upper - target rate at the end of the quarter (4) Represent weighted average contractual rates Fed Funds Rate Interest - bearing deposit cost Loan Yield Loan & Deposit Beta (1) Fed Funds Rate & Cost of CDs Cost of CDs (2) Time Horizon: Change in the Fed Funds Rate: Deposit Beta: Aug 24 – Aug 25 - 100 bps 71% Aug 25 – Present - 25 bps 45%
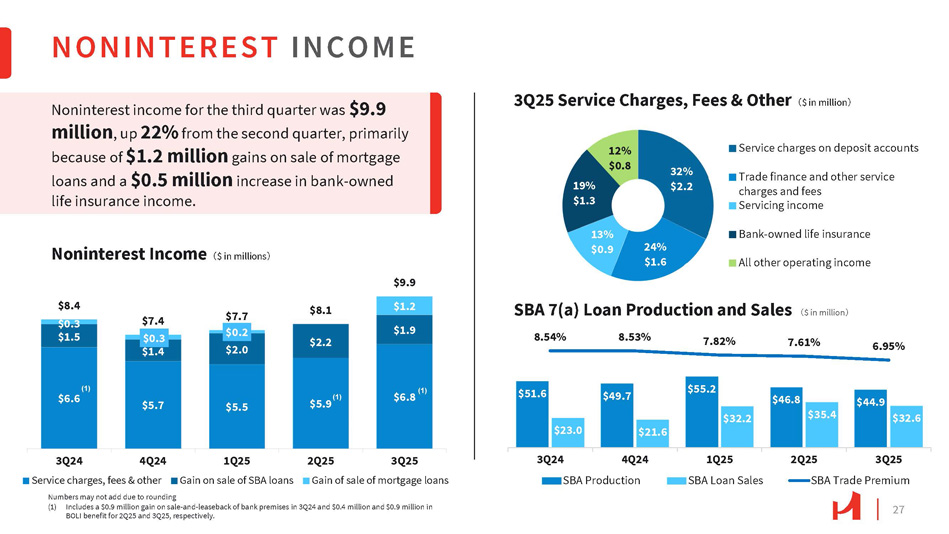
27 32% $2.2 24% $1.6 13% $0.9 19% $1.3 12% $0.8 Service charges on deposit accounts Trade finance and other service charges and fees Servicing income Bank - owned life insurance All other operating income NONINTEREST INCOME $51.6 $49.7 $55.2 $46.8 $44.9 $23.0 $21.6 $32.2 $35.4 $32.6 8.54% 8.53% 7.82% 7.61% 6.95% 3Q24 4Q24 SBA Production 1Q25 SBA Loan Sales 2Q25 3Q25 SBA Trade Premium $5.7 $5.5 $5.9 $1.4 $2.0 $2.2 $0.3 $0.2 $1.2 $1.9 $8.4 $0.3 $1.5 $7.4 $7.7 $8.1 $9.9 3Q24 4Q24 Service charges, fees & other 1Q25 Gain on sale of SBA loans 2Q25 3Q25 Gain of sale of mortgage loans (1) $6.6 Numbers may not add due to rounding (1) Includes a $0.9 million gain on sale - and - leaseback of bank premises in 3Q24 and $0.4 million and $0.9 million in BOLI benefit for 2Q25 and 3Q25, respectively. Noninterest income for the third quarter was $9.9 million , up 22% from the second quarter, primarily because of $1.2 million gains on sale of mortgage loans and a $0.5 million increase in bank - owned life insurance income. Noninterest Income 㸦 $ in millions 㸧 3Q25 Service Charges, Fees & Other 㸦 $ in million 㸧 SBA 7(a) Loan Production and Sales 㸦 $ in million 㸧 (1) $6.8 (1)
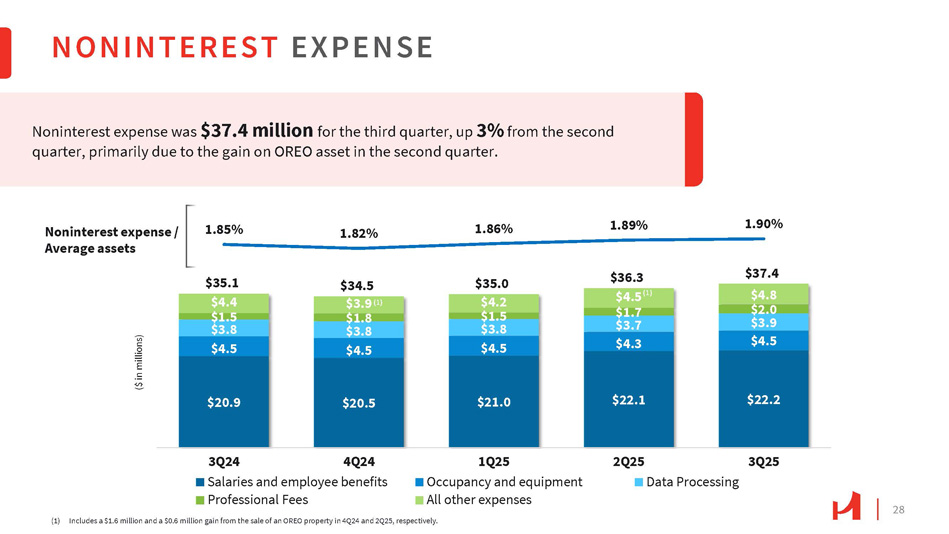
NONINTEREST EXPENSE 28 (1) Includes a $1.6 million and a $0.6 million gain from the sale of an OREO property in 4Q24 and 2Q25, respectively. Noninterest expense was $37.4 million for the third quarter, up 3% from the second quarter, primarily due to the gain on OREO asset in the second quarter. $20.9 $20.5 $21.0 $22.1 $22.2 $35.1 $4.4 $1.5 $3.8 $4.5 $35.0 $4.2 $1.5 $3.8 $4.5 $37.4 $4.8 $2.0 $3.9 $4.5 1.85% 1.82% 1.86% 1.89% 1.90% 3Q24 4Q24 Salaries and employee benefits Professional Fees 1Q25 Occupancy and equipment All other expenses $34.5 $3.9 (1) $1.8 $3.8 $4.5 $36.3 $4.5 (1) $1.7 $3.7 $4.3 2Q25 3Q25 Data Processing Noninterest expense / Average assets ($ in millions)
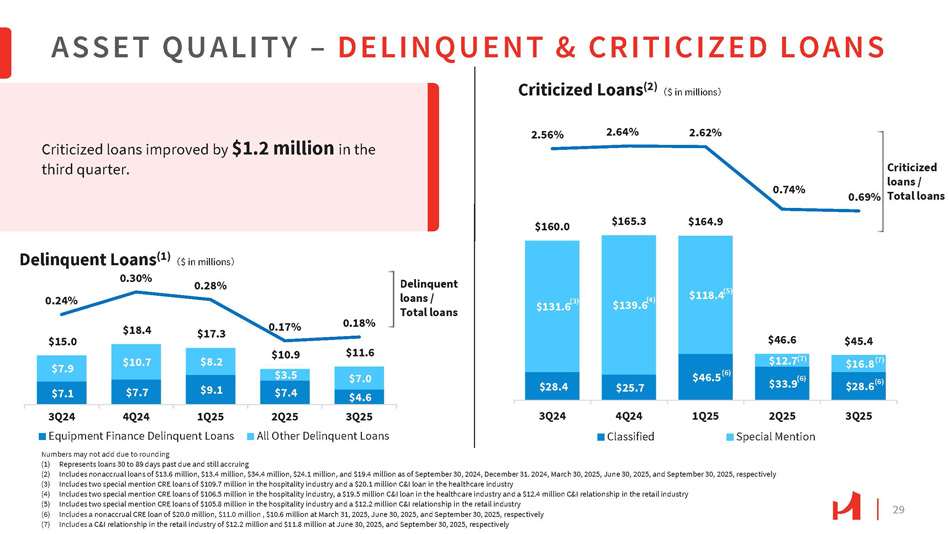
29 $7.7 $9.1 $10.7 $8.2 $15.0 $7.9 $7.1 $18.4 $17.3 $10.9 $3.5 $7.4 $11.6 $7.0 $4.6 0.24% 0.30% 0.28% 0.17% 0.18% 2Q25 3Q25 All Other Delinquent Loans 3Q24 4Q24 1Q25 Equipment Finance Delinquent Loans Numbers may not add due to rounding ASSET QUALITY – DELINQUENT & CRITICIZED LOANS Delinquent loans / Total loans $139.6 $160.0 $165.3 $164.9 2.56% 2.64% 2.62% 0.74% Criticized loans / 0.69% Total loans $131.6 (3) (1) Represents loans 30 to 89 days past due and still accruing (2) Includes nonaccrual loans of $13.6 million, $13.4 million, $34.4 million, $24.1 million, and $19.4 million as of September 30, 2024, December 31. 2024, March 30, 2025, June 30, 2025, and September 30, 2025, respectively (3) Includes two special mention CRE loans of $109.7 million in the hospitality industry and a $20.1 million C&I loan in the healthcare industry (4) Includes two special mention CRE loans of $106.5 million in the hospitality industry, a $19.5 million C&I loan in the healthcare industry and a $12.4 million C&I relationship in the retail industry (5) Includes two special mention CRE loans of $105.8 million in the hospitality industry and a $12.2 million C&I relationship in the retail industry (6) Includes a nonaccrual CRE loan of $20.0 million, $11.0 million , $10.6 million at March 31, 2025, June 30, 2025, and September 30, 2025, respectively (7) Includes a C&I relationship in the retail industry of $12.2 million and $11.8 million at June 30, 2025, and September 30, 2025, respectively (4) Criticized loans improved by $1.2 million in the third quarter. Delinquent Loans (1) 㸦 $ in millions 㸧 Criticized Loans (2) 㸦 $ in millions 㸧 $118.4 (5) $45.4 $46.6 $16.8 (7) $28.6 (6) $12.7 (7) $33.9 (6) $46.5 (6) $25.7 $28.4 3Q25 2Q25 Special Mention 1Q25 4Q24 Classified 3Q24
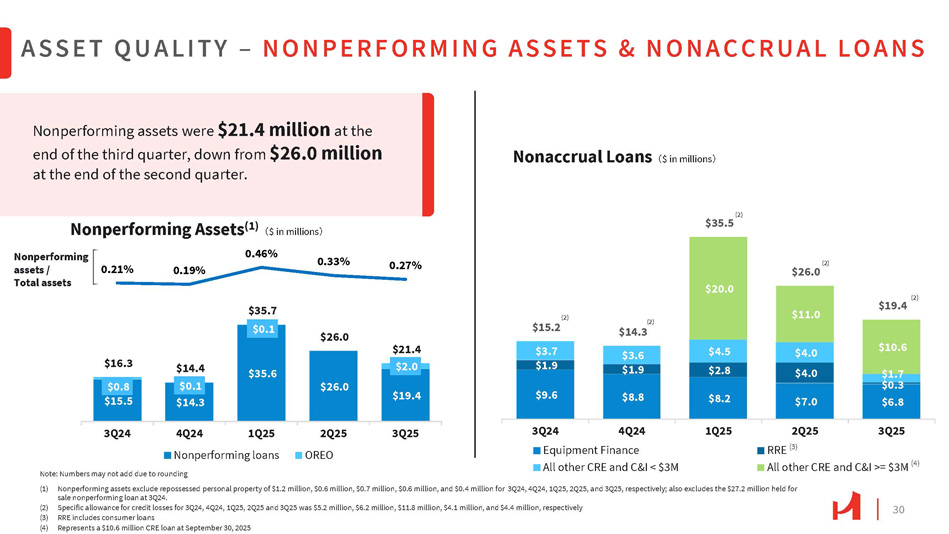
30 Nonperforming assets were $21.4 million at the end of the third quarter, down from $26.0 million at the end of the second quarter. $15.5 $14.3 $35.6 $26.0 $19.4 $0.8 $0.1 $0.1 $2.0 $16.3 $14.4 $35.7 $26.0 $21.4 0.21% 0.19% 0.46% 0.33% 0.27% 3Q25 2Q25 OREO 3Q24 4Q24 1Q25 Nonperforming loans Note: Numbers may not add due to rounding ASSET QUALITY – NONPERFORMING ASSETS & NONACCRUAL LOANS (1) Nonperforming assets exclude repossessed personal property of $1.2 million, $0.6 million, $0.7 million, $0.6 million, and $0.4 million for 3Q24, 4Q24, 1Q25, 2Q25, and 3Q25, respectively; also excludes the $27.2 million held for sale nonperforming loan at 3Q24. (2) Specific allowance for credit losses for 3Q24, 4Q24, 1Q25, 2Q25 and 3Q25 was $5.2 million, $6.2 million, $11.8 million, $4.1 million, and $4.4 million, respectively (3) RRE includes consumer loans (4) Represents a $10.6 million CRE loan at September 30, 2025 (2) $35.5 1Q25 3Q24 4Q24 Equipment Finance All other CRE and C&I < $3M (2) $19.4 $11.0 $20.0 (2) $14.3 (2) $15.2 $10.6 $1.7 $0.3 $6.8 $4.0 $4.0 $7.0 $4.5 $2.8 $8.2 $3.6 $1.9 $8.8 $3.7 $1.9 $9.6 (2) $26.0 2Q25 3Q25 RRE (3) All other CRE and C&I >= $3M (4) Nonperforming Assets (1) 㸦 $ in millions 㸧 Nonaccrual Loans 㸦 $ in millions 㸧 Nonperforming assets / Total assets
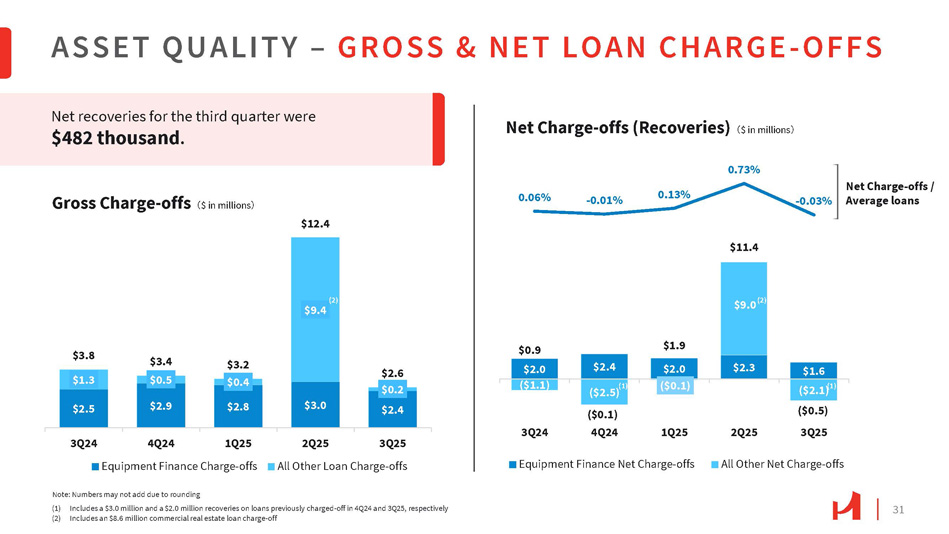
31 $2.5 $2.9 $2.8 $3.0 $2.4 $1.3 $0.5 $0.4 $0.2 $3.8 $3.4 $3.2 $12.4 $2.6 (2) $9.4 3Q24 4Q24 1Q25 Equipment Finance Charge - offs 2Q25 3Q25 All Other Loan Charge - offs ASSET QUALITY – GROSS & NET LOAN CHARGE - OFFS $2.4 $2.3 $1.6 ($0.1) $0.9 $2.0 ($1.1) $1.9 $2.0 $9.0 (2) ($2.5) (1) ($0.1) 4Q24 ($2.1) (1) ($0.5) 3Q25 $11.4 0.06% - 0.01% 0.13% 0.73% 3Q24 1Q25 2Q25 Equipment Finance Net Charge - offs All Other Net Charge - offs Note: Numbers may not add due to rounding (1) Includes a $3.0 million and a $2.0 million recoveries on loans previously charged - off in 4Q24 and 3Q25, respectively (2) Includes an $8.6 million commercial real estate loan charge - off Net recoveries for the third quarter were $482 thousand . Gross Charge - offs 㸦 $ in millions 㸧 Net Charge - offs (Recoveries) 㸦 $ in millions 㸧 Net Charge - offs / - 0.03% Average loans
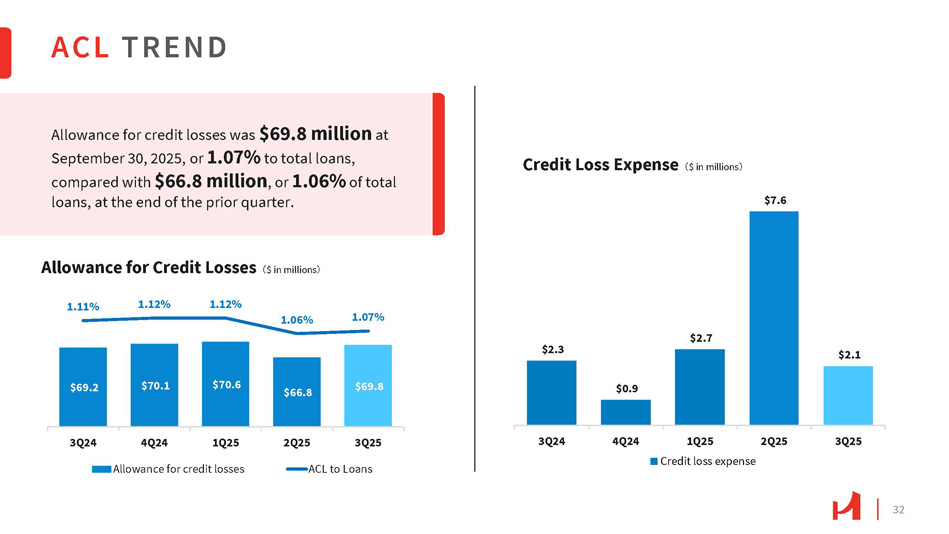
32 $69.2 $70.1 $70.6 $66.8 $69.8 1.11% 1.12% 1.12% 1.06% 1.07% 3Q24 4Q24 1Q25 Allowance for credit losses 2Q25 3Q25 ACL to Loans $2.3 $0.9 $2.7 $7.6 $2.1 3Q24 4Q24 1Q25 Credit loss expense 2Q25 3Q25 Allowance for credit losses was $69.8 million at September 30, 2025, or 1.07% to total loans, compared with $66.8 million , or 1.06% of total loans, at the end of the prior quarter. Allowance for Credit Losses 㸦 $ in millions 㸧 Credit Loss Expense 㸦 $ in millions 㸧 ACL TREND
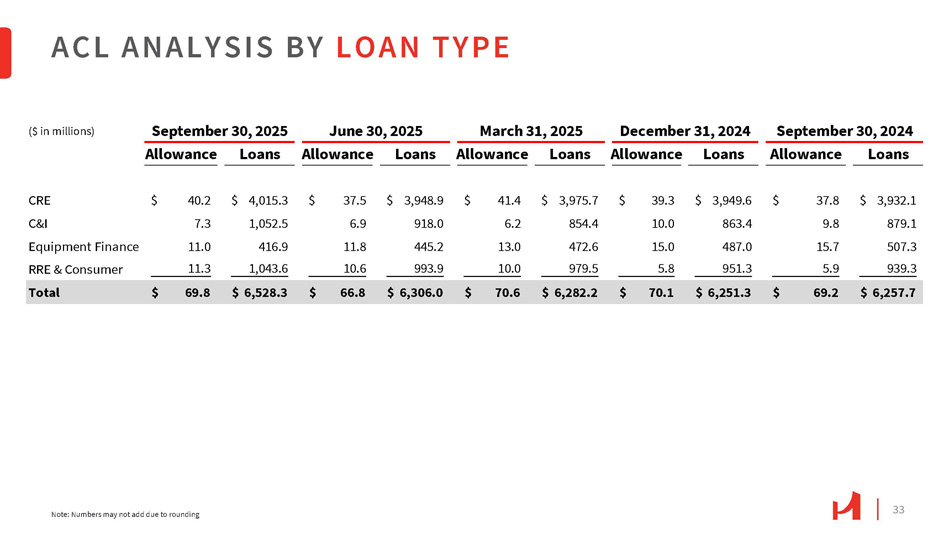
33 ACL ANALYSIS BY LOAN TYPE Note: Numbers may not add due to rounding Loans Allowance Loans Allowance Loans Allowance Loans Allowance Loans Allowance $ 3,932.1 $ 37.8 $ 3,949.6 $ 39.3 $ 3,975.7 $ 41.4 $ 3,948.9 $ 37.5 $ 4,015.3 $ 40.2 CRE 879.1 9.8 863.4 10.0 854.4 6.2 918.0 6.9 1,052.5 7.3 C&I 507.3 15.7 487.0 15.0 472.6 13.0 445.2 11.8 416.9 11.0 Equipment Finance 939.3 5.9 951.3 5.8 979.5 10.0 993.9 10.6 1,043.6 11.3 RRE & Consumer $ 6,257.7 $ 69.2 $ 6,251.3 $ 70.1 $ 6,282.2 $ 70.6 $ 6,306.0 $ 66.8 $ 6,528.3 $ 69.8 Total ($ in millions) September 30, 2025 June 30, 2025 March 31, 2025 December 31, 2024 September 30, 2024
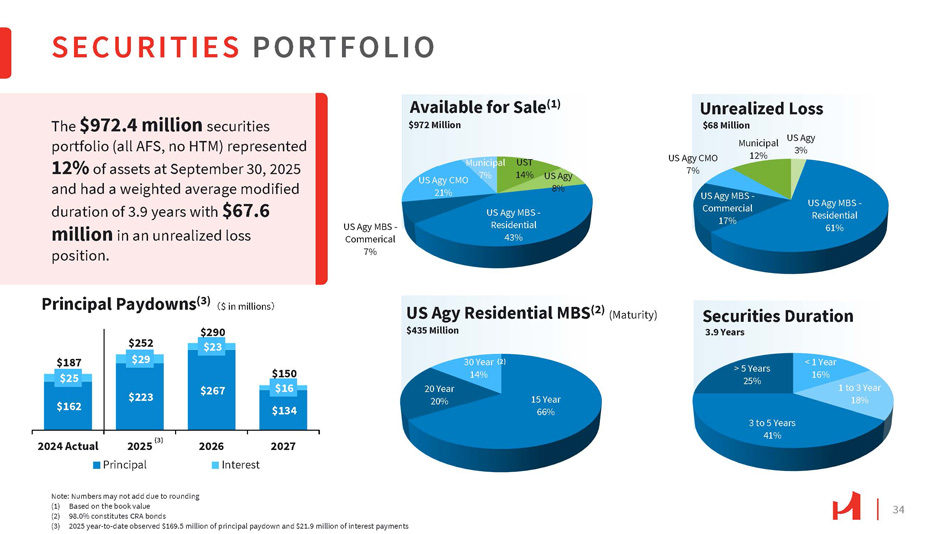
34 15 Year 66% 20 Year 20% SECURITIES PORTFOLIO $162 $223 $267 $134 $25 $29 $23 $16 $187 $252 $290 $150 2024 Actual 2027 2026 Interest 3% US Agy MBS - Residential 61% US Agy MBS - Commercial 17% US Agy CMO 7% Municipal 12% US Agy 8% US Agy MBS - Residential 43% US Agy MBS - Commerical 7% US Agy CMO 21% Municipal UST 7% 14% Available for Sale (1) $972 Million < 1 Year 16% 1 to 3 Year 18% 3 to 5 Years 41% > 5 Years 25% Unrealized Loss $68 Million US Agy Securities Duration 3.9 Years $435 Million 30 Year (2) 14% 2025 (3) Principal Note: Numbers may not add due to rounding (1) Based on the book value (2) 98.0% constitutes CRA bonds (3) 2025 year - to - date observed $169.5 million of principal paydown and $21.9 million of interest payments The $972.4 million securities portfolio (all AFS, no HTM) represented 12% of assets at September 30, 2025 and had a weighted average modified duration of 3.9 years with $67.6 million in an unrealized loss position. Principal Paydowns (3) 㸦 $ in millions 㸧 US Agy Residential MBS (2) (Maturity)
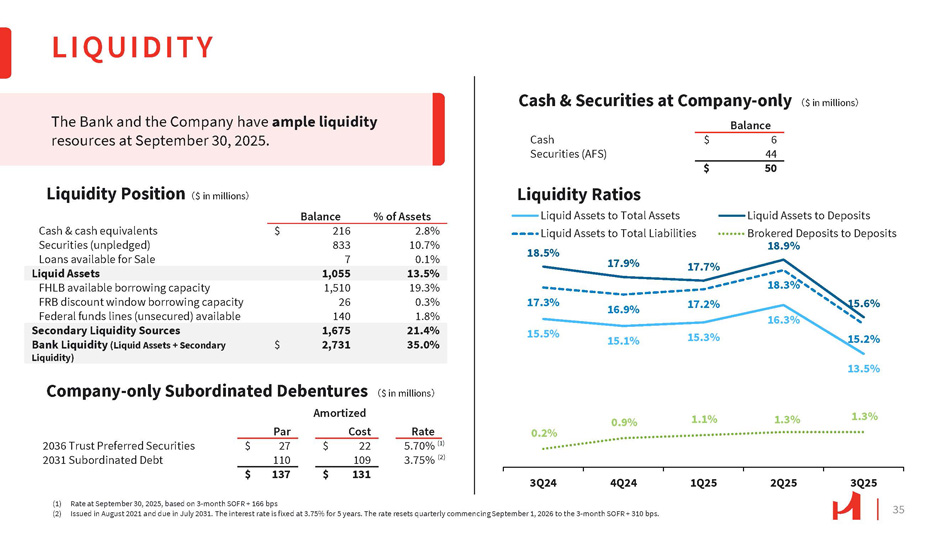
35 LIQUIDITY 3Q24 4Q24 (1) Rate at September 30, 2025, based on 3 - month SOFR + 166 bps (2) Issued in August 2021 and due in July 2031. The interest rate is fixed at 3.75% for 5 years. The rate resets quarterly commencing September 1, 2026 to the 3 - month SOFR + 310 bps. 15.5% 15.1% 15.3% 16.3% 13.5% 18.5% 17.9% 17.7% Liquid Assets to Deposits Brokered Deposits to Deposits 18.9% 15.6% 17.3% 16.9% 17.2% 18.3% 15.2% 0.2% 0.9% 1.1% 1.3% 1.3% 1Q25 2Q25 3Q25 Liquid Assets to Total Assets Liquid Assets to Total Liabilities Liquidity Position 㸦 $ in millions 㸧 Cash & Securities at Company - only 㸦 $ in millions 㸧 Company - only Subordinated Debentures 㸦 $ in millions 㸧 Liquidity Ratios % of Assets Balance 2.8% 216 $ Cash & cash equivalents 10.7% 833 Securities (unpledged) 0.1% 7 Loans available for Sale 13.5% 1,055 Liquid Assets 19.3% 1,510 FHLB available borrowing capacity 0.3% 26 FRB discount window borrowing capacity 1.8% 140 Federal funds lines (unsecured) available 21.4% 1,675 Secondary Liquidity Sources 35.0% 2,731 $ Bank Liquidity (Liquid Assets + Secondary Liquidity) Balance 6 $ Cash 44 Securities (AFS) 50 $ Amortized Rate Cost Par 5.70% 22 $ 27 $ 2036 Trust Preferred Securities 3.75% 109 110 2031 Subordinated Debt 131 $ 137 $ The Bank and the Company have ample liquidity resources at September 30, 2025. (1) (2)
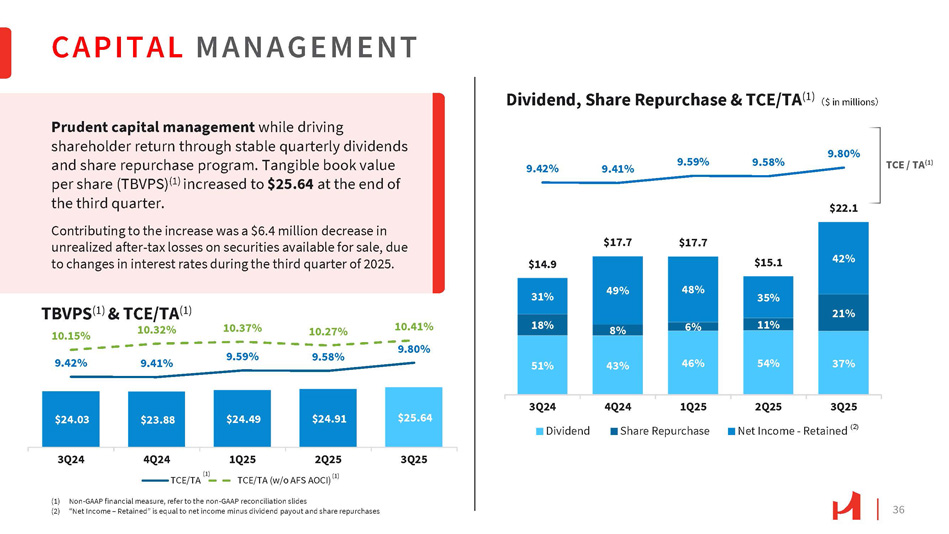
36 42% $14.9 $17.7 $17.7 $15.1 $22.1 9.42% 9.41% 9.59% 9.58% 9.80% 3Q24 Dividend 4Q24 1Q25 Share Repurchase 2Q25 3Q25 Net Income - Retained (2) $24.03 $23.88 $24.49 $24.91 $25.64 3Q24 4Q24 3Q25 (1) TCE/TA 1Q25 2Q25 TCE/TA (w/o AFS AOCI) (1) (1) Non - GAAP financial measure, refer to the non - GAAP reconciliation slides (2) “Net Income – Retained” is equal to net income minus dividend payout and share repurchases CAPITAL MANAGEMENT TCE / TA (1) Prudent capital management while driving shareholder return through stable quarterly dividends and share repurchase program. Tangible book value per share (TBVPS) (1) increased to $25.64 at the end of the third quarter. Contributing to the increase was a $6.4 million decrease in unrealized after - tax losses on securities available for sale, due to changes in interest rates during the third quarter of 2025. 35% 48% 49% 31% 21% 11% 6% 8% 18% 10.41% 10.27% 10.37% TBVPS (1) & TCE/TA (1) 10.15% 10.32% 37% 54% 46% 43% 51% 9.80% 9.58% 9.59% 9.42% 9.41% Dividend, Share Repurchase & TCE/TA (1) 㸦 $ in millions 㸧
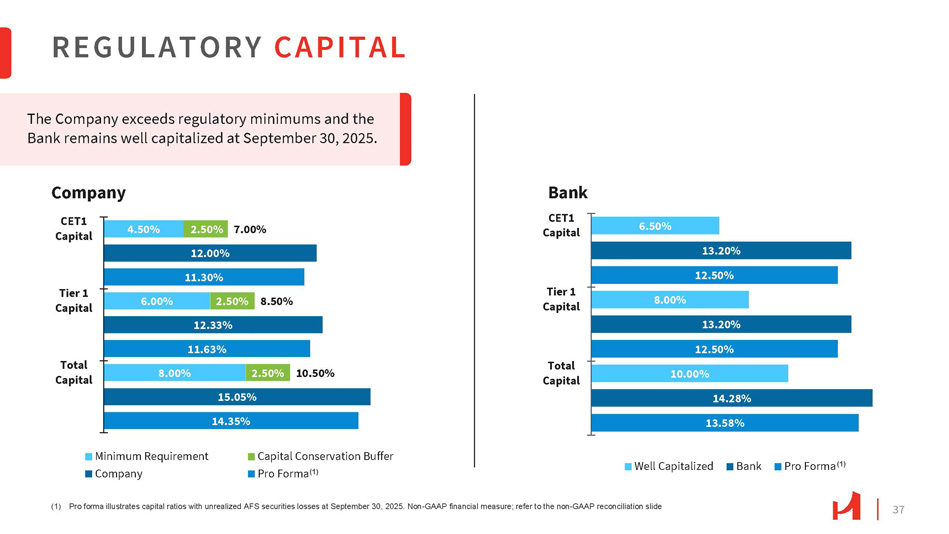
37 REGULATORY CAPITAL 8.00% 6.00% 4.50% 2.50% 15.05% 14.35% 2.50% 12.33% 11.63% 10.50% 8.50% 2.50% 7.00% 12.00% 11.30% Total Capital Tier 1 Capital CET1 Capital Minimum Requirement Company Capital Conservation Buffer Pro Forma (1) 8.00% 6.50% 13.20% 12.50% 10.00% 14.28% 13.58% 13.20% 12.50% Total Capital Tier 1 Capital Bank CET1 Capital Well Capitalized Bank Pro Forma (1) (1) Pro forma illustrates capital ratios with unrealized AFS securities losses at September 30, 2025. Non - GAAP financial measure; refer to the non - GAAP reconciliation slide Company The Company exceeds regulatory minimums and the Bank remains well capitalized at September 30, 2025.
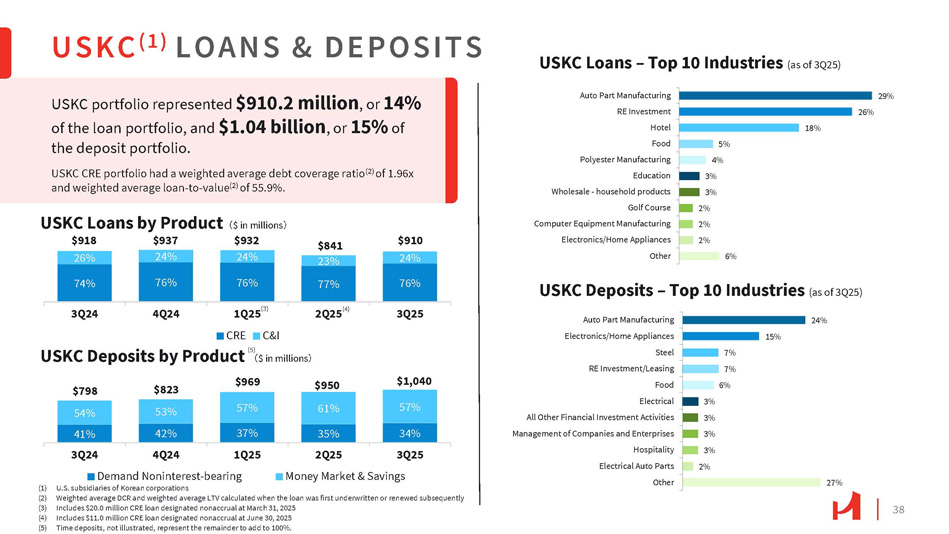
USKC ( 1 ) LOANS & DEPOSITS USKC portfolio represented $910.2 million , or 14% of the loan portfolio, and $1.04 billion , or 15% of the deposit portfolio. USKC CRE portfolio had a weighted average debt coverage ratio (2) of 1.96x and weighted average loan - to - value (2) of 55.9%. USKC Loans – Top 10 Industries (as of 3Q25) 29% 26% 18% 5% 4% 3% 3% 2% 2% 2% 6% Auto Part Manufacturing RE Investment Hotel Food Polyester Manufacturing Education Wholesale - household products Golf Course Computer Equipment Manufacturing Electronics/Home Appliances Other 24% Auto Part Manufacturing 15% Electronics/Home Appliances 7% Steel 7% RE Investment/Leasing 6% Food 3% Electrical 3% All Other Financial Investment Activities 3% Management of Companies and Enterprises 3% Hospitality 2% Electrical Auto Parts 27% Other 38 USKC Deposits – Top 10 Industries (as of 3Q25) $918 26% 74% $937 24% 76% $932 24% 76% $841 23% 77% $910 24% 76% 3Q24 4Q24 3Q25 USKC Loans by Product 㸦 $ in millions 㸧 1Q25 (3) CRE C&I 2Q25 (4) USKC Deposits by Product 㸦 $ in millions 㸧 $798 $823 $969 $950 57% 61% 57% 53% 54% 34% 35% 37% 42% 41% 3Q25 2Q25 1Q25 4Q24 3Q24 $1,040 Demand Noninterest - bearing Money Market & Savings (1) U.S. subsidiaries of Korean corporations (2) Weighted average DCR and weighted average LTV calculated when the loan was first underwritten or renewed subsequently (3) Includes $20.0 million CRE loan designated nonaccrual at March 31, 2025 (4) Includes $11.0 million CRE loan designated nonaccrual at June 30, 2025 (5) Time deposits, not illustrated, represent the remainder to add to 100%. (5)
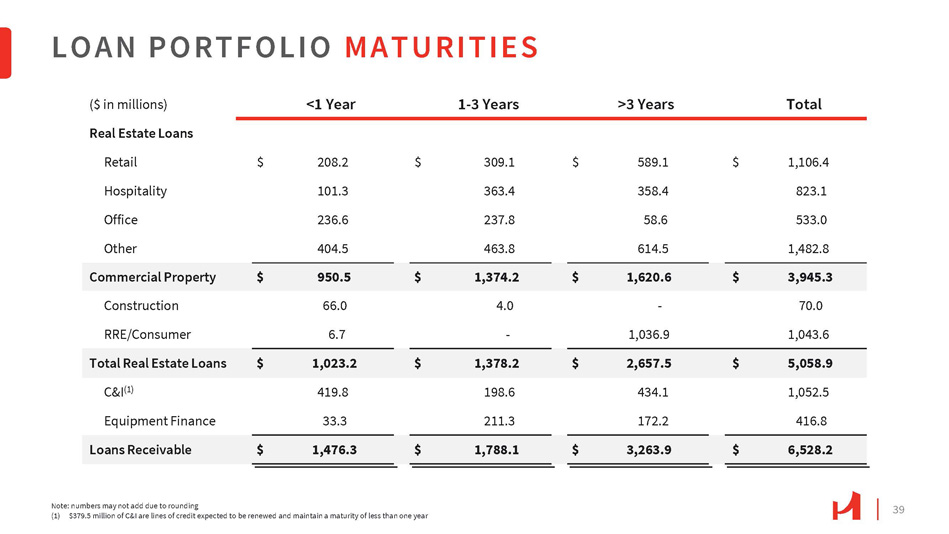
39 Total >3 Years 1 - 3 Years <1 Year ($ in millions) Real Estate Loans 1,106.4 $ 589.1 $ 309.1 $ 208.2 $ Retail 823.1 358.4 363.4 101.3 Hospitality 533.0 58.6 237.8 236.6 Office 1,482.8 614.5 463.8 404.5 Other 3,945.3 $ 1,620.6 $ 1,374.2 $ 950.5 $ Commercial Property 70.0 - 4.0 66.0 Construction 1,043.6 1,036.9 - 6.7 RRE/Consumer 5,058.9 $ 2,657.5 $ 1,378.2 $ 1,023.2 $ Total Real Estate Loans 1,052.5 434.1 198.6 419.8 C&I (1) 416.8 172.2 211.3 33.3 Equipment Finance 6,528.2 $ 3,263.9 $ 1,788.1 $ 1,476.3 $ Loans Receivable LOAN PORTFOLIO MATURITIES Note: numbers may not add due to rounding (1) $379.5 million of C&I are lines of credit expected to be renewed and maintain a maturity of less than one year
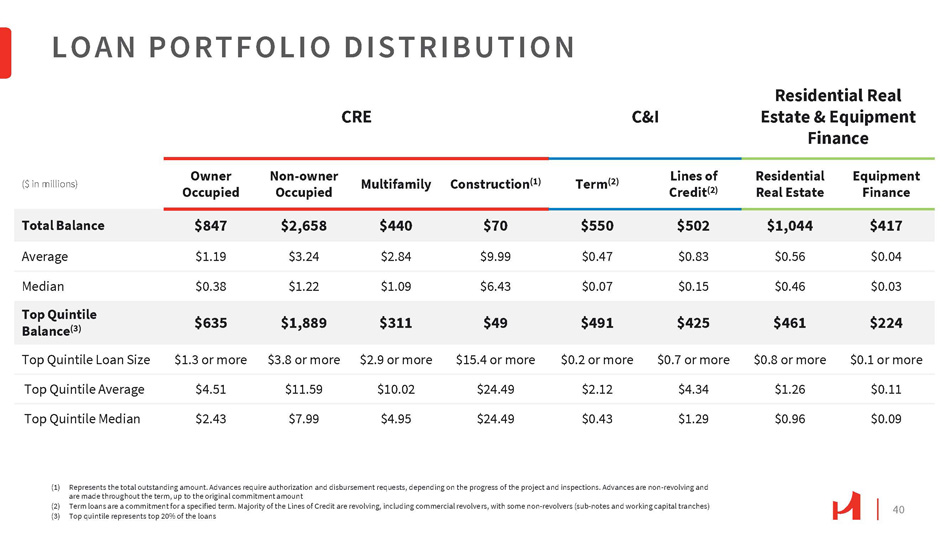
40 LOAN PORTFOLIO DISTRIBUTION Residential Real Estate & Equipment Finance C&I CRE Equipment Finance Residential Real Estate Lines of Credit (2) Term (2) Construction (1) Multifamily Non - owner Occupied Owner Occupied ($ in millions) $417 $1,044 $502 $550 $70 $440 $2,658 $847 Total Balance $0.04 $0.56 $0.83 $0.47 $9.99 $2.84 $3.24 $1.19 Average $0.03 $0.46 $0.15 $0.07 $6.43 $1.09 $1.22 $0.38 Median $224 $461 $425 $491 $49 $311 $1,889 $635 Top Quintile Balance (3) $0.1 or more $0.8 or more $0.7 or more $0.2 or more $15.4 or more $2.9 or more $3.8 or more $1.3 or more Top Quintile Loan Size $0.11 $1.26 $4.34 $2.12 $24.49 $10.02 $11.59 $4.51 Top Quintile Average $0.09 $0.96 $1.29 $0.43 $24.49 $4.95 $7.99 $2.43 Top Quintile Median (1) Represents the total outstanding amount. Advances require authorization and disbursement requests, depending on the progress of the project and inspections. Advances are non - revolving and are made throughout the term, up to the original commitment amount (2) Term loans are a commitment for a specified term. Majority of the Lines of Credit are revolving, including commercial revolvers, with some non - revolvers (sub - notes and working capital tranches) (3) Top quintile represents top 20% of the loans
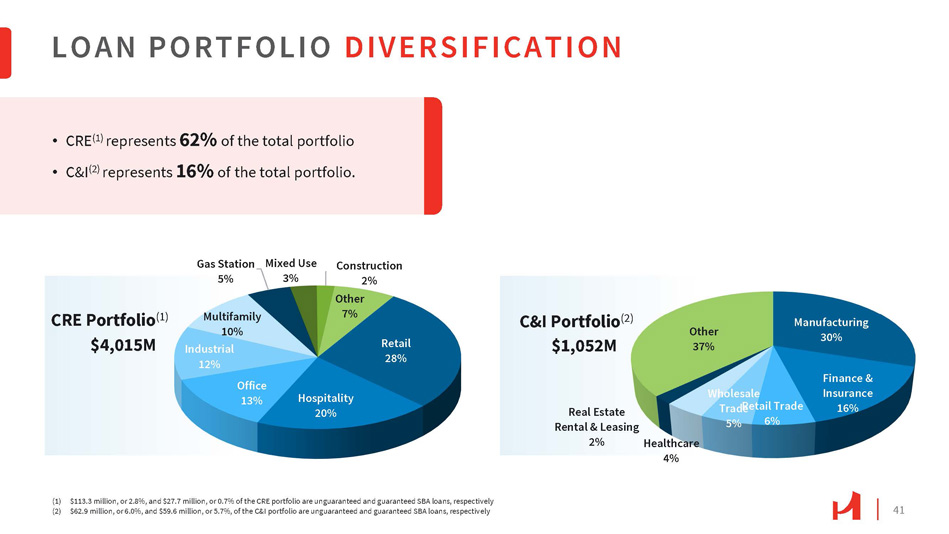
LOAN PORTFOLIO DIVERSIFICATION (1) $113.3 million, or 2.8%, and $27.7 million, or 0.7% of the CRE portfolio are unguaranteed and guaranteed SBA loans, respectively (2) $62.9 million, or 6.0%, and $59.6 million, or 5.7%, of the C&I portfolio are unguaranteed and guaranteed SBA loans, respectively Retail 28% Hospitality 20% Office 13% Industrial 12% Multifamily 10% Gas Station 5% Mixed Use 3% Construction 2% Other 7% CRE Portfolio (1) $4,015M Manufacturing 30% Finance & Insurance 16% 6% Wholesale Tra d R e etail Trade 5% Healthcare 4% Real Estate Rental & Leasing 2% Other 37% C&I Portfolio (2) $1,052M • CRE (1) represents 62% of the total portfolio • C&I (2) represents 16% of the total portfolio. 41
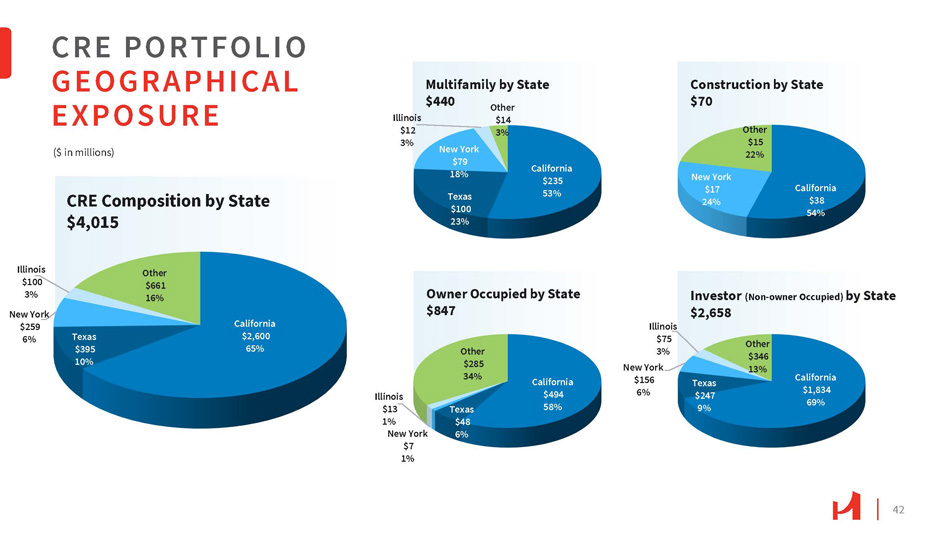
California $2,600 65% Texas $395 10% Illinois $100 3% New York $259 6% Other $661 16% CRE Composition by State $4,015 CRE PORTFOLIO GEOGRAPHICAL EXPOSURE 42 California $38 54% $17 24% Construction by State $70 Other $15 22% New York California Other $285 34% Owner Occupied by State $847 California $1,834 69% Texas 6% $247 $494 Illinois 9% 58% Texas $13 $48 1% 6% New York $7 1% Illinois $75 3% New York $156 Other $346 13% Investor (Non - owner Occupied) by State $2,658 California $235 53% $100 23% New York $79 18% Texas Illinois $12 3% Other $14 3% Multifamily by State $440 ($ in millions)
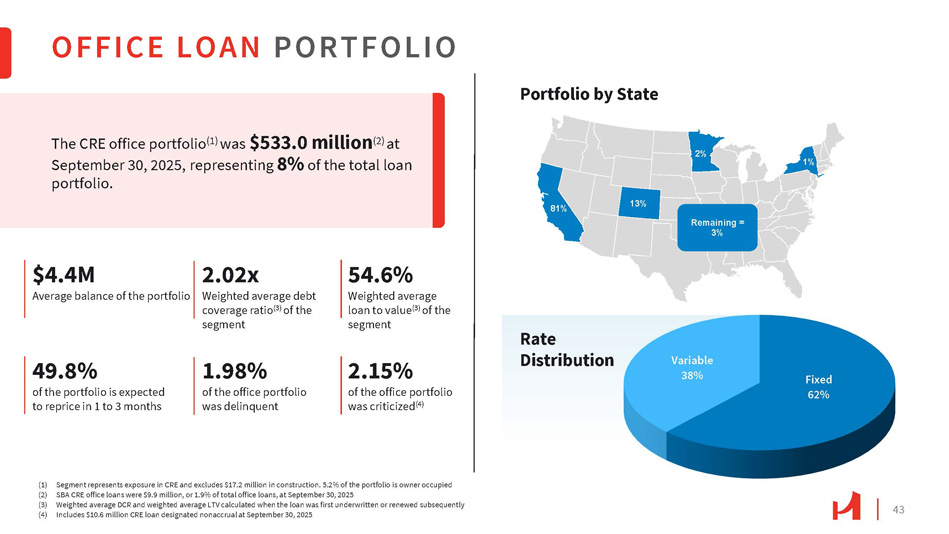
Rate Distribution Portfolio by State Fixed 62% Variable 38% OFFICE LOAN PORTFOLIO 43 (1) Segment represents exposure in CRE and excludes $17.2 million in construction. 5.2% of the portfolio is owner occupied (2) SBA CRE office loans were $9.9 million, or 1.9% of total office loans, at September 30, 2025 (3) Weighted average DCR and weighted average LTV calculated when the loan was first underwritten or renewed subsequently (4) Includes $10.6 million CRE loan designated nonaccrual at September 30, 2025 The CRE office portfolio (1) was $533.0 million (2) at September 30, 2025, representing 8% of the total loan portfolio. $4.4M Average balance of the portfolio 2.02x Weighted average debt coverage ratio (3) of the segment 54.6% Weighted average loan to value (3) of the segment 49.8% of the portfolio is expected to reprice in 1 to 3 months 1.98% of the office portfolio was delinquent 2.15% of the office portfolio was criticized (4) Remaining = 3% 81% 13% 2% 1%
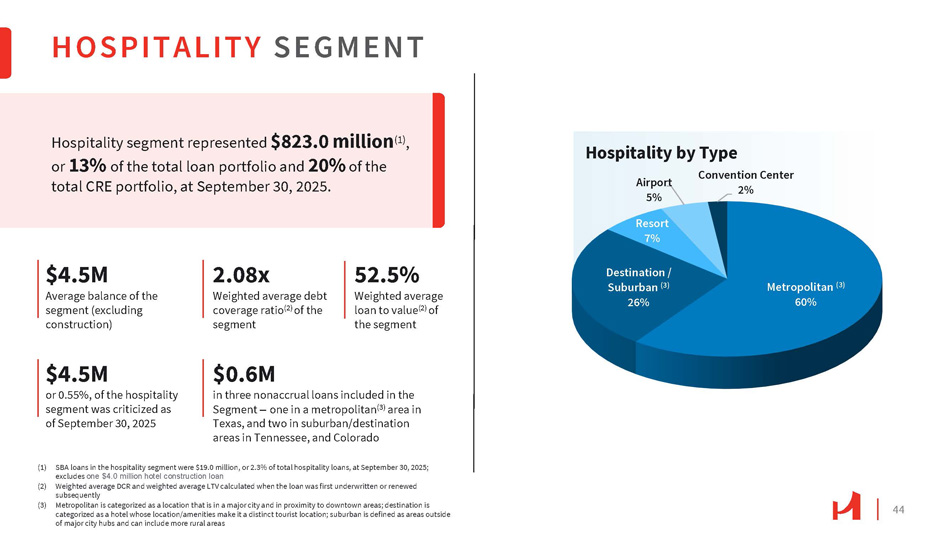
44 HOSPITALITY SEGMENT (1) SBA loans in the hospitality segment were $19.0 million, or 2.3% of total hospitality loans, at September 30, 2025; excludes one $4.0 million hotel construction loan (2) Weighted average DCR and weighted average LTV calculated when the loan was first underwritten or renewed subsequently (3) Metropolitan is categorized as a location that is in a major city and in proximity to downtown areas; destination is categorized as a hotel whose location/amenities make it a distinct tourist location; suburban is defined as areas outside of major city hubs and can include more rural areas Hospitality segment represented $823.0 million (1) , or 13% of the total loan portfolio and 20% of the total CRE portfolio, at September 30, 2025. $4.5M Average balance of the segment (excluding construction) 2.08x Weighted average debt coverage ratio (2) of the segment 52.5% Weighted average loan to value (2) of the segment $4.5M or 0.55%, of the hospitality segment was criticized as of September 30, 2025 $0.6M in three nonaccrual loans included in the Segment – one in a metropolitan (3) area in Texas, and two in suburban/destination areas in Tennessee, and Colorado Metropolitan (3) 60% Destination / Suburban (3) 26% Airport 5% Resort 7% Convention Center 2% Hospitality by Type
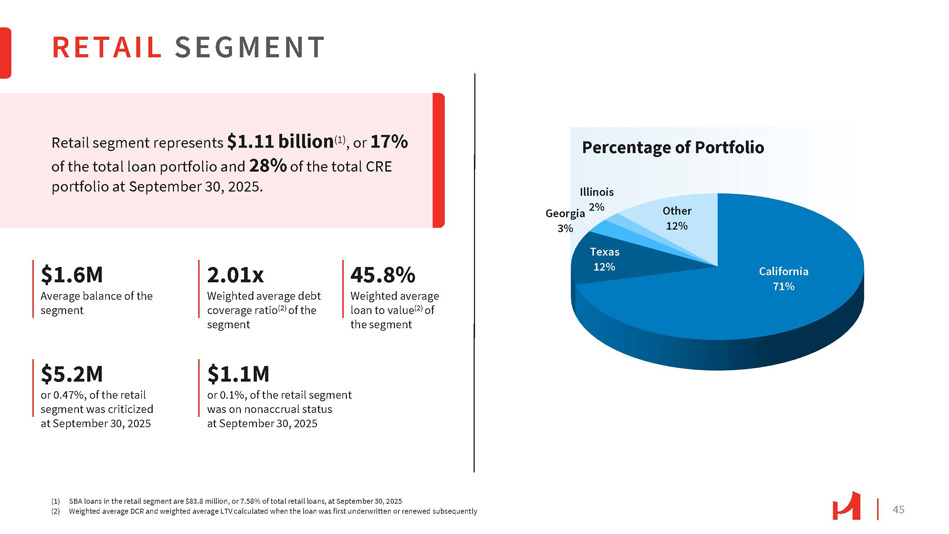
45 RETAIL SEGMENT Retail segment represents $1.11 billion (1) , or 17% of the total loan portfolio and 28% of the total CRE portfolio at September 30, 2025. $1.6M Average balance of the segment 2.01x Weighted average debt coverage ratio (2) of the segment 45.8% Weighted average loan to value (2) of the segment $5.2M or 0.47%, of the retail segment was criticized at September 30, 2025 $1.1M or 0.1%, of the retail segment was on nonaccrual status at September 30, 2025 California 71% Texas 12% Illinois Georgia 2% 3% Other 12% Percentage of Portfolio (1) SBA loans in the retail segment are $83.8 million, or 7.58% of total retail loans, at September 30, 2025 (2) Weighted average DCR and weighted average LTV calculated when the loan was first underwritten or renewed subsequently
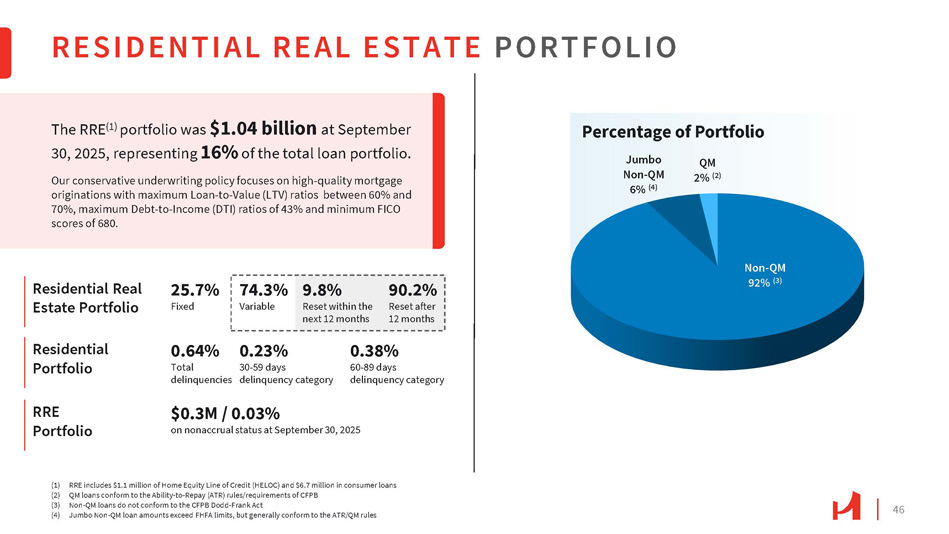
46 Residential Portfolio RRE Portfolio RESIDENTIAL REAL ESTATE PORTFOLIO The RRE (1) portfolio was $1.04 billion at September 30, 2025, representing 16% of the total loan portfolio. Our conservative underwriting policy focuses on high - quality mortgage originations with maximum Loan - to - Value (LTV) ratios between 60% and 70%, maximum Debt - to - Income (DTI) ratios of 43% and minimum FICO scores of 680. 25.7% Fixed Non - QM 92% (3) Jumbo Non - QM 6% (4) QM 2% (2) (1) RRE includes $1.1 million of Home Equity Line of Credit (HELOC) and $6.7 million in consumer loans (2) QM loans conform to the Ability - to - Repay (ATR) rules/requirements of CFPB (3) Non - QM loans do not conform to the CFPB Dodd - Frank Act (4) Jumbo Non - QM loan amounts exceed FHFA limits, but generally conform to the ATR/QM rules Residential Real Estate Portfolio 74.3% Variable 0.64% 0.23% Total 30 - 59 days delinquencies delinquency category 9.8% 90.2% Reset within the Reset after next 12 months 12 months 0.38% 60 - 89 days delinquency category $0.3M / 0.03% on nonaccrual status at September 30, 2025 Percentage of Portfolio
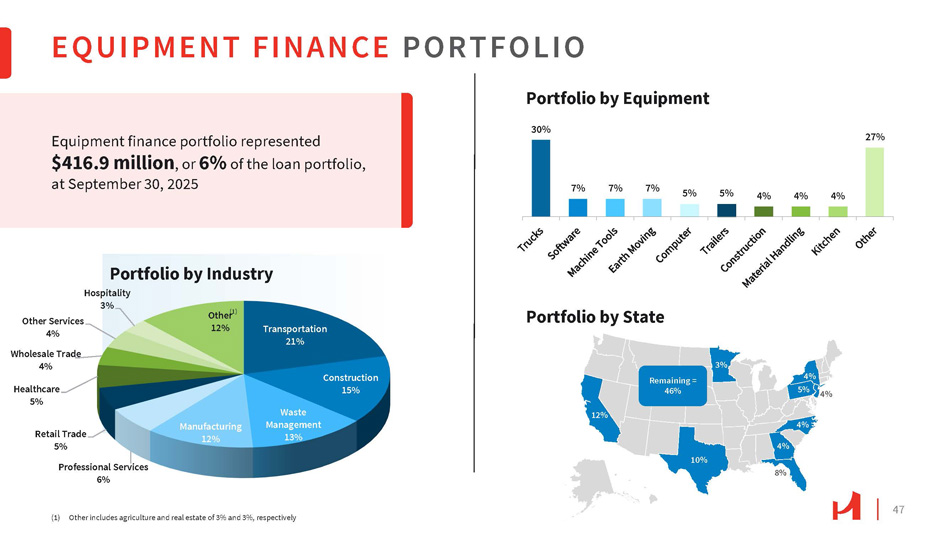
4% 4% 5% Remaining = 46% 12% 10% 4% 8% 4% 3% EQUIPMENT FINANCE PORTFOLIO 47 Transportation 21% Construction 15% Waste Management 13% Manufacturing 12% Professional Services 6% Retail Trade 5% Other Services 4% Wholesale Trade 4% Healthcare 5% Hospitality 3% Portfolio by Industry Other (1) 12% (1) Other includes agriculture and real estate of 3% and 3%, respectively Equipment finance portfolio represented $416.9 million , or 6% of the loan portfolio, at September 30, 2025 30% 7% 7% 7% 5% 5% 4% 4% 4% 27% Portfolio by Equipment Portfolio by State
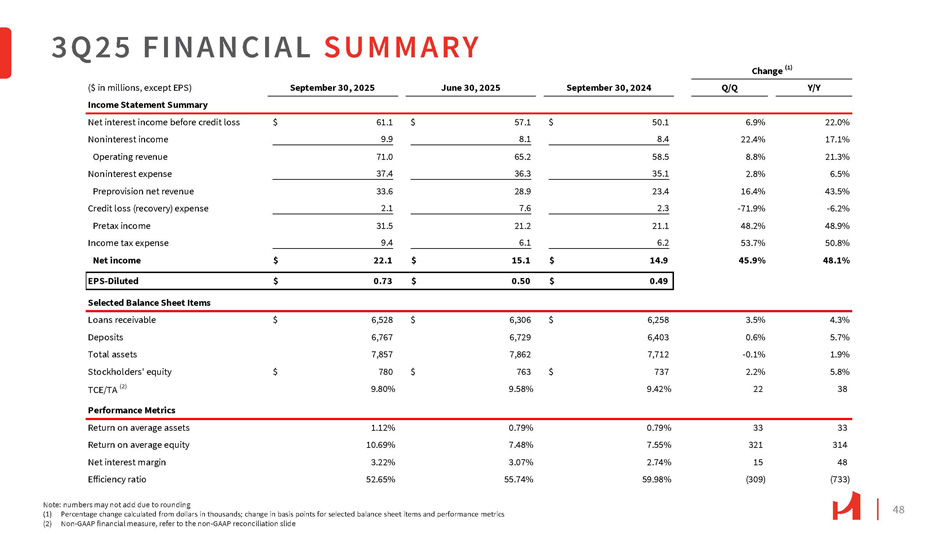
48 3 Q 25 FINANCIAL SUMMARY Note: numbers may not add due to rounding (1) Percentage change calculated from dollars in thousands; change in basis points for selected balance sheet items and performance metrics (2) Non - GAAP financial measure, refer to the non - GAAP reconciliation slide ($ in millions, except EPS) September 30, 2025 June 30, 2025 Income Statement Summary September 30, 2024 Q/Q Y/Y 22.0% 6.9% 50.1 $ 57.1 $ 61.1 $ Net interest income before credit loss 17.1% 22.4% 8.4 8.1 9.9 Noninterest income 21.3% 8.8% 58.5 65.2 71.0 Operating revenue 6.5% 2.8% 35.1 36.3 37.4 Noninterest expense 43.5% 16.4% 23.4 28.9 33.6 Preprovision net revenue - 6.2% - 71.9% 2.3 7.6 2.1 Credit loss (recovery) expense 48.9% 48.2% 21.1 21.2 31.5 Pretax income 50.8% 53.7% 6.2 6.1 9.4 Income tax expense 48.1% 45.9% 14.9 $ 15.1 $ 22.1 $ Net income 0.49 $ 0.50 $ 0.73 $ EPS - Diluted Selected Balance Sheet Items 4.3% 3.5% 6,258 $ 6,306 $ 6,528 $ Loans receivable 5.7% 0.6% 6,403 6,729 6,767 Deposits 1.9% - 0.1% 7,712 7,862 7,857 Total assets 5.8% 2.2% 737 $ 763 $ 780 $ Stockholders' equity 38 22 9.42% 9.58% 9.80% TCE/TA (2) Performance Metrics 33 33 0.79% 0.79% 1.12% Return on average assets 314 321 7.55% 7.48% 10.69% Return on average equity 48 15 2.74% 3.07% 3.22% Net interest margin (733) (309) 59.98% 55.74% 52.65% Efficiency ratio Change (1)
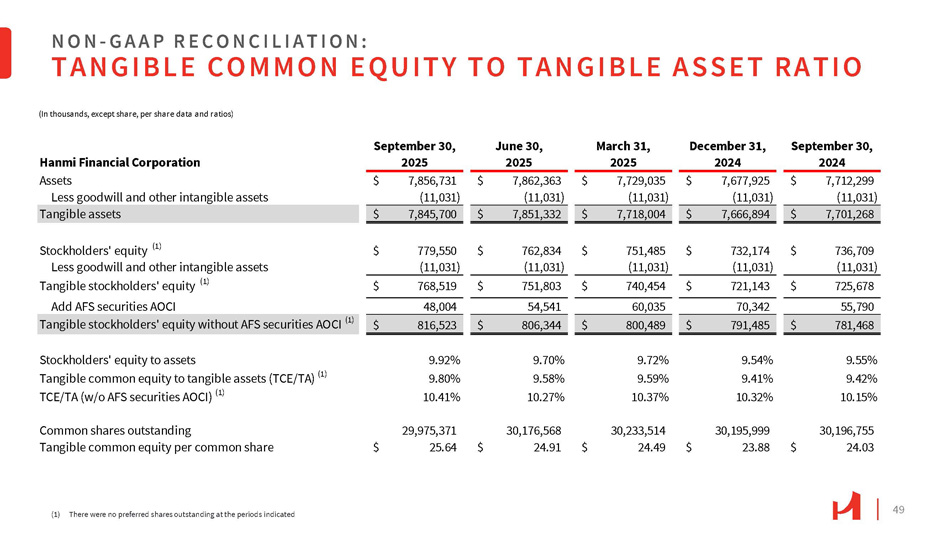
49 NON - G A A P R E C O N C I L I A T I O N : TANGIBLE COMMON EQUITY TO TANGIBLE ASSET RATIO (1) There were no preferred shares outstanding at the periods indicated September 30, December 31, March 31, June 30, September 30, 2024 2024 2025 2025 2025 Hanmi Financial Corporation 7,712,299 $ 7,677,925 $ 7,729,035 $ 7,862,363 $ 7,856,731 $ Assets (11,031) (11,031) (11,031) (11,031) (11,031) Less goodwill and other intangible assets $ 7,701,268 $ 7,666,894 $ 7,718,004 $ 7,851,332 $ 7,845,700 Tangible assets 736,709 $ 732,174 $ 751,485 $ 762,834 $ 779,550 $ Stockholders' equity (1) (11,031) (11,031) (11,031) (11,031) (11,031) Less goodwill and other intangible assets 725,678 $ 721,143 $ 740,454 $ 751,803 $ 768,519 $ (1) Tangible stockholders' equity 55,790 70,342 60,035 54,541 48,004 Add AFS securities AOCI $ 781,468 $ 791,485 $ 800,489 $ 806,344 $ 816,523 Tangible stockholders' equity without AFS securities AOCI (1) 9.55% 9.54% 9.72% 9.70% 9.92% Stockholders' equity to assets 9.42% 9.41% 9.59% 9.58% 9.80% Tangible common equity to tangible assets (TCE/TA) (1) 10.15% 10.32% 10.37% 10.27% 10.41% TCE/TA (w/o AFS securities AOCI) (1) 30,196,755 30,195,999 30,233,514 30,176,568 29,975,371 Common shares outstanding 24.03 $ 23.88 $ 24.49 $ 24.91 $ 25.64 $ Tangible common equity per common share (In thousands, except share, per share data and ratios)
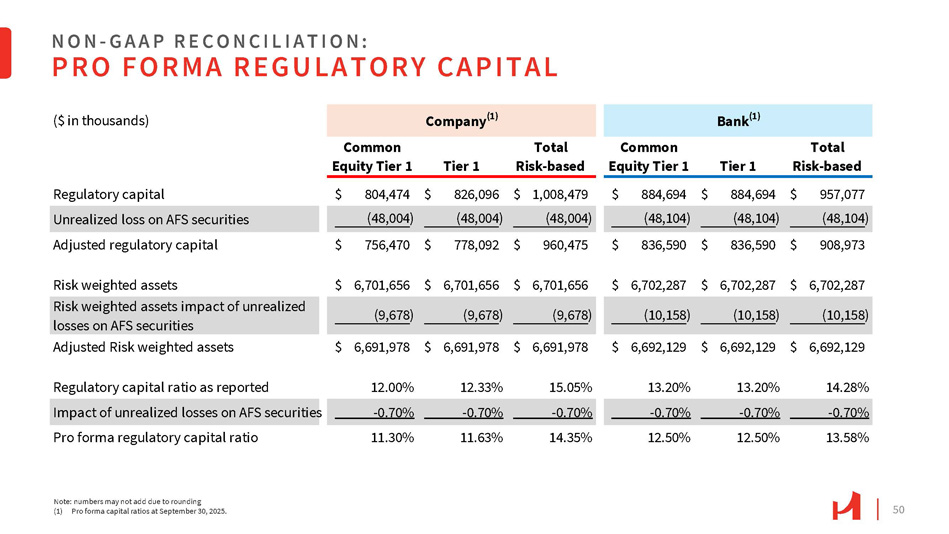
50 NON - G A A P R E C O N C I L I A T I O N : PRO FORMA REGULATORY CAPITAL Bank (1) Company (1) ($ in thousands) Total Risk - based Tier 1 Common Equity Tier 1 Total Risk - based Tier 1 Common Equity Tier 1 $ 957,077 $ 884,694 $ 884,694 $ 1,008,479 $ 826,096 $ 804,474 Regulatory capital (48,104 ) (48,104 ) (48,104 ) (48,004 ) (48,004 ) (48,004 ) Unrealized loss on AFS securities $ 908,973 $ 836,590 $ 836,590 $ 960,475 $ 778,092 $ 756,470 Adjusted regulatory capital $ 6,702,287 $ 6,702,287 $ 6,702,287 $ 6,701,656 $ 6,701,656 $ 6,701,656 Risk weighted assets (10,158 ) (10,158 ) (10,158 ) (9,678 ) (9,678 ) (9,678 ) Risk weighted assets impact of unrealized losses on AFS securities $ 6,692,129 $ 6,692,129 $ 6,692,129 $ 6,691,978 $ 6,691,978 $ 6,691,978 Adjusted Risk weighted assets 14.28% 13.20% 13.20% 15.05% 12.33% 12.00% Regulatory capital ratio as reported - 0.70% - 0.70% - 0.70% - 0.70% - 0.70% - 0.70% Impact of unrealized losses on AFS securities 13.58% 12.50% 12.50% 14.35% 11.63% 11.30% Pro forma regulatory capital ratio Note: numbers may not add due to rounding (1) Pro forma capital ratios at September 30, 2025.