Exhibit 99.2
California | Colorado | Georgia | Illinois | New Jersey | New York | Texas | Virginia | Washington 1 Q 2 6 Ea rning s S u pp l e m en ta l Pre s en tat i o n April 21, 2026 NASDAQ | HAFC
2 TABLE OF CONTENTS 1Q26 PERFORMANCE RESULTS 5 – 21 LOAN PORTFOLIO DETAILS 22 – 30 1Q26 FINANCIAL SUMMARY 31 – 31 NON - GAAP RECONCILIATION 32 – 34
3 FORWARD - LOOKING STATEMENTS Hanmi Financial Corporation (the “Company”) cautions investors that any statements contained herein that are not historical facts are forward - looking statements within the meaning of the “safe harbor” provisions of the Private Securities Litigation Reform Act of 1995 , including, but not limited to, those statements regarding operating performance, financial position, financial results and liquidity, business strategies, regulatory, economic and competitive outlook, investment and expenditure plans, capital and financing needs and availability, litigation, plans and objectives, merger or sale activity, and all other forecasts and statements of expectation or assumption underlying any of the foregoing . These statements involve known and unknown risks and uncertainties that are difficult to predict . Investors should not rely on any forward - looking statement and should consider risks, such as a failure to maintain adequate levels of capital and liquidity to support our operations, general economic and business conditions internationally, nationally and in those areas in which we operate, including any potential recessionary conditions, volatility and deterioration in the credit and equity markets, changes in investor sentiment or consumer spending, borrowing and savings habits, availability of capital from private and government sources, demographic changes, competition for loans and deposits and failure to attract or retain loans and deposits, inflation and fluctuations in interest rates that reduce our margins and yields, the fair value of financial instruments, the level of loan originations or prepayments on loans we have made and make, the level of loan sales and the cost we pay to retain and attract deposits and secure other types of funding, our ability to enter new markets successfully and capitalize on growth opportunities, the current or anticipated impact of military conflict, terrorism, or other geopolitical events, the effect of potential future supervisory action against us or Hanmi Bank and our ability to address any issues raised in our regulatory exams, risks of natural disasters, legal proceedings and litigation brought against us, a failure in or breach of our operational or security systems or infrastructure, including cyberattacks, the failure to maintain current technologies, risks associated with Small Business Administration loans, failure to attract or retain key employees, our ability to access cost - effective funding, the imposition of tariffs or other domestic or international governmental policies and any retaliatory responses, the impact of a potential federal government shutdown, which may impact on our ability to effect sales of small business administration loans, changes in liquidity, including the size and composition of our deposit portfolio and the percentage of uninsured deposits in the portfolio, fluctuations in real estate values, changes in accounting policies and practices, changes in governmental regulation, including, but not limited to, any increase in FDIC insurance premiums and changes in the monetary policies of the U . S . Treasury and the Board of Governors of the Federal Reserve System, the ability of Hanmi Bank to make distributions to Hanmi Financial Corporation, which is restricted by certain factors, including Hanmi Bank’s retained earnings, net income, prior distributions made, and certain other financial tests, strategic transactions we may enter into, including the costs associated with the evaluation of any strategic opportunities and the overall effects of any acquisitions or dispositions we may make, the adequacy of and changes in the economic assumptions and methodology for computing our allowance for credit losses, our credit quality and the effect of credit quality on our credit losses expense and allowance for credit losses, changes in the financial performance and/or condition of our borrowers and the ability of our borrowers to perform under the terms of their loans and other terms of credit agreements, our ability to control expenses, and cyber security and fraud risks against our information technology and those of our third - party providers and vendors . Forward - looking statements are based upon the good faith beliefs and expectations of management as of this date only and are further subject to additional risks and uncertainties, including, but not limited to, the risk factors set forth in our earnings release dated April 21 , 2026 , including the section titled “Forward Looking Statements” and the Company’s most recent Form 10 - K, 10 - Q and other filings with the Securities and Exchange Commission . The Company disclaims any obligation to update or revise the forward - looking statements herein .
4 NON - GAAP FINANCIAL INFORMATION This presentation contains financial information determined by methods other than in accordance with accounting principles generally accepted in the United States of America (“GAAP”) . These non - GAAP measures include tangible common equity to tangible assets, tangible common equity per share (including without the impact of available for sale securities on the accumulated other comprehensive income) and pro forma regulatory capital . Management uses these “non - GAAP” measures in its analysis of the Company’s performance . Management believes these non - GAAP financial measures allow for better comparability of period to period operating performance . Additionally, the Company believes this information is utilized by regulators and market analysts to evaluate a company’s financial condition and therefore, such information is useful to investors . These disclosures should not be viewed as a substitute for operating results determined in accordance with GAAP, nor are they necessarily comparable to non - GAAP performance measures that may be presented by other companies . A reconciliation of the non - GAAP measures used in this presentation to the most directly comparable GAAP measures is provided in the Appendix to this presentation .
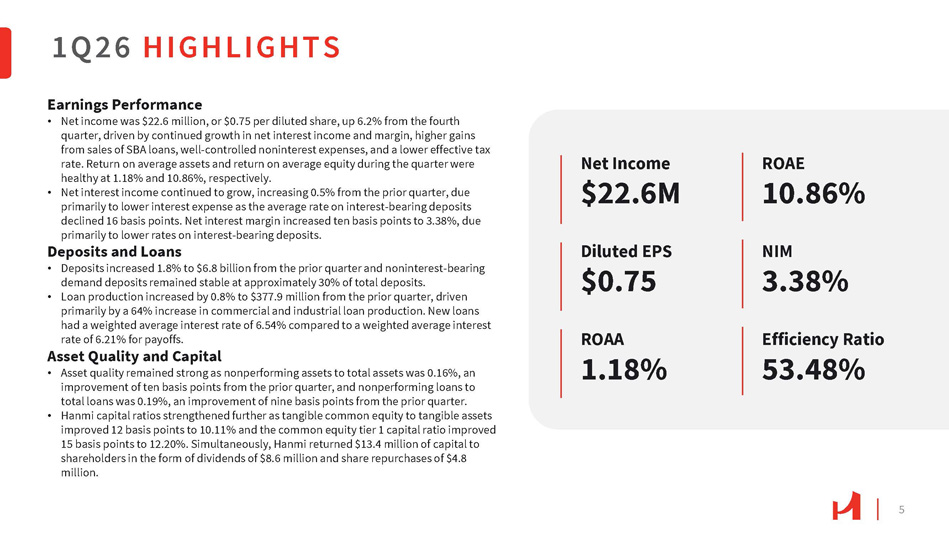
5 Net Income $22.6M Diluted EPS $0.75 ROAA 1.18% ROAE 10.86% NIM 3.38% Efficiency Ratio 53.48% Earnings Performance • Net income was $22.6 million, or $0.75 per diluted share, up 6.2% from the fourth quarter, driven by continued growth in net interest income and margin, higher gains from sales of SBA loans, well - controlled noninterest expenses, and a lower effective tax rate. Return on average assets and return on average equity during the quarter were healthy at 1.18% and 10.86%, respectively. • Net interest income continued to grow, increasing 0.5% from the prior quarter, due primarily to lower interest expense as the average rate on interest - bearing deposits declined 16 basis points. Net interest margin increased ten basis points to 3.38%, due primarily to lower rates on interest - bearing deposits. Deposits and Loans • Deposits increased 1.8% to $6.8 billion from the prior quarter and noninterest - bearing demand deposits remained stable at approximately 30% of total deposits. • Loan production increased by 0.8% to $377.9 million from the prior quarter, driven primarily by a 64% increase in commercial and industrial loan production. New loans had a weighted average interest rate of 6.54% compared to a weighted average interest rate of 6.21% for payoffs. Asset Quality and Capital • Asset quality remained strong as nonperforming assets to total assets was 0 . 16 % , an improvement of ten basis points from the prior quarter, and nonperforming loans to total loans was 0 . 19 % , an improvement of nine basis points from the prior quarter . • Hanmi capital ratios strengthened further as tangible common equity to tangible assets improved 12 basis points to 10.11% and the common equity tier 1 capital ratio improved 15 basis points to 12.20%. Simultaneously, Hanmi returned $13.4 million of capital to shareholders in the form of dividends of $8.6 million and share repurchases of $4.8 million. 1Q26 HIGHLIGHTS
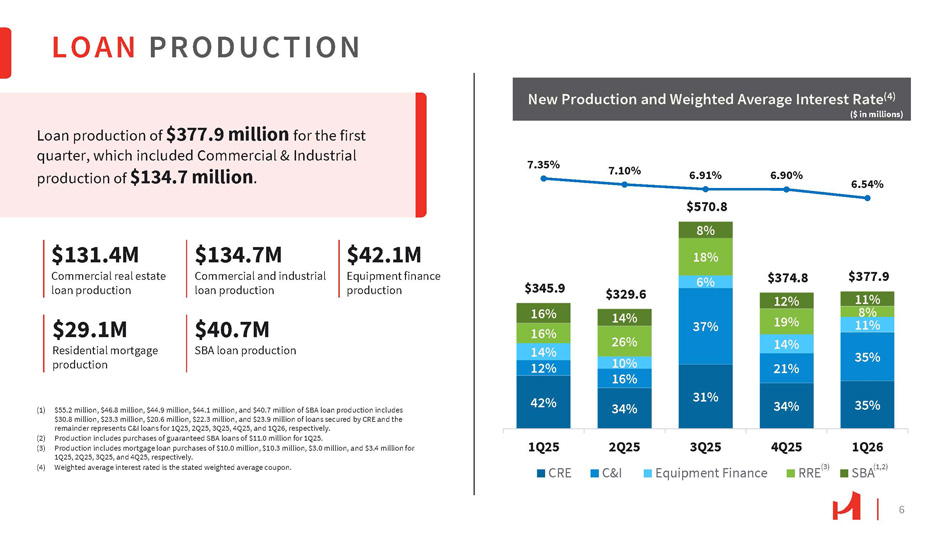
LOAN PRODUCTION 6 Loan production of $377.9 million for the first quarter, which included Commercial & Industrial production of $134.7 million . (1) $55.2 million, $46.8 million, $44.9 million, $44.1 million, and $40.7 million of SBA loan production includes $30.8 million, $23.3 million, $20.6 million, $22.3 million, and $23.9 million of loans secured by CRE and the remainder represents C&I loans for 1Q25, 2Q25, 3Q25, 4Q25, and 1Q26, respectively. (2) Production includes purchases of guaranteed SBA loans of $11.0 million for 1Q25. (3) Production includes mortgage loan purchases of $10.0 million, $10.3 million, $3.0 million, and $3.4 million for 1Q25, 2Q25, 3Q25, and 4Q25, respectively. (4) Weighted average interest rated is the stated weighted average coupon. $131.4M Commercial real estate loan production $134.7M Commercial and industrial loan production $42.1M Equipment finance production $29.1M Residential mortgage production $40.7M SBA loan production 42% 31% 34% 35% 37% 6% $345.9 16% 16% 14% 12% $329.6 14% 26% 10% 16% 34% $570.8 8% 18% $374.8 12% 19% 14% 21% $377.9 11% 8% 11% 35% 7.35% 7.10% 6.91% 6.90% 6.54% 1Q26 SBA (1,2) 1Q25 CRE 2Q25 C&I 3Q25 Equipment Finance 4Q25 RRE (3) New Production and Weighted Average Interest Rate (4) ($ in millions)
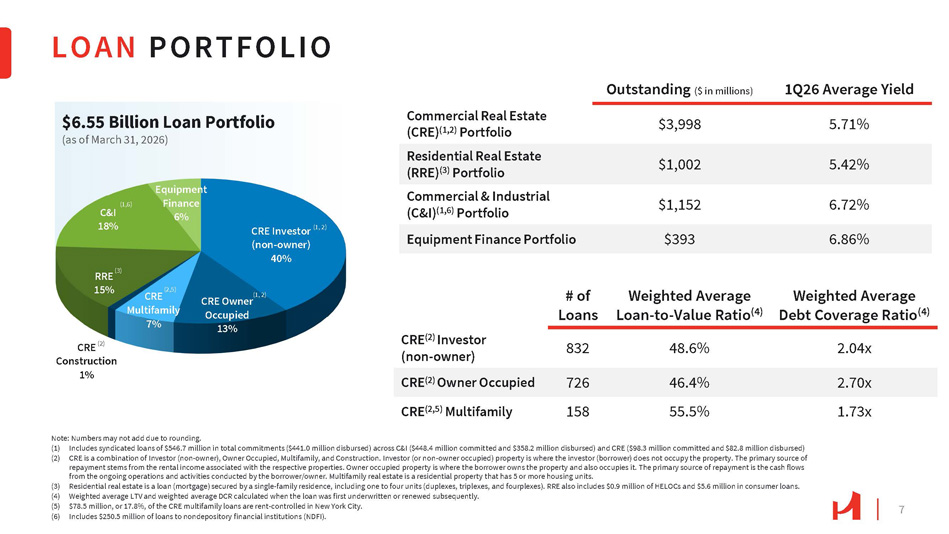
CRE Owner Occupied 13% 15% Equipment Finance 6% CRE (2) Construction 1% (2,5) CRE Multifamily 7% (1, 2) CRE Investor (1, 2) (non - owner) 40% RRE (3) (1,6) C&I 18% $6.55 Billion Loan Portfolio (as of March 31, 2026) LOAN PORTFOLIO 7 Note: Numbers may not add due to rounding. (1) Includes syndicated loans of $546.7 million in total commitments ($441.0 million disbursed) across C&I ($448.4 million committed and $358.2 million disbursed) and CRE ($98.3 million committed and $82.8 million disbursed) (2) CRE is a combination of Investor (non - owner), Owner Occupied, Multifamily, and Construction. Investor (or non - owner occupied) property is where the investor (borrower) does not occupy the property. The primary source of repayment stems from the rental income associated with the respective properties. Owner occupied property is where the borrower owns the property and also occupies it. The primary source of repayment is the cash flows from the ongoing operations and activities conducted by the borrower/owner. Multifamily real estate is a residential property that has 5 or more housing units. (3) Residential real estate is a loan (mortgage) secured by a single - family residence, including one to four units (duplexes, triplexes, and fourplexes). RRE also includes $0.9 million of HELOCs and $5.6 million in consumer loans. (4) Weighted average LTV and weighted average DCR calculated when the loan was first underwritten or renewed subsequently. (5) $78.5 million, or 17.8%, of the CRE multifamily loans are rent - controlled in New York City. (6) Includes $250.5 million of loans to nondepository financial institutions (NDFI). 1Q26 Average Yield Outstanding ($ in millions) 5.71% $3,998 Commercial Real Estate (CRE) (1,2) Portfolio 5.42% $1,002 Residential Real Estate (RRE) (3) Portfolio 6.72% $1,152 Commercial & Industrial (C&I) (1,6) Portfolio 6.86% $393 Equipment Finance Portfolio Weighted Average Debt Coverage Ratio (4) Weighted Average Loan - to - Value Ratio (4) # of Loans 2.04x 48.6% 832 CRE (2) Investor (non - owner) 2.70x 46.4% 726 CRE (2) Owner Occupied 1.73x 55.5% 158 CRE (2,5) Multifamily
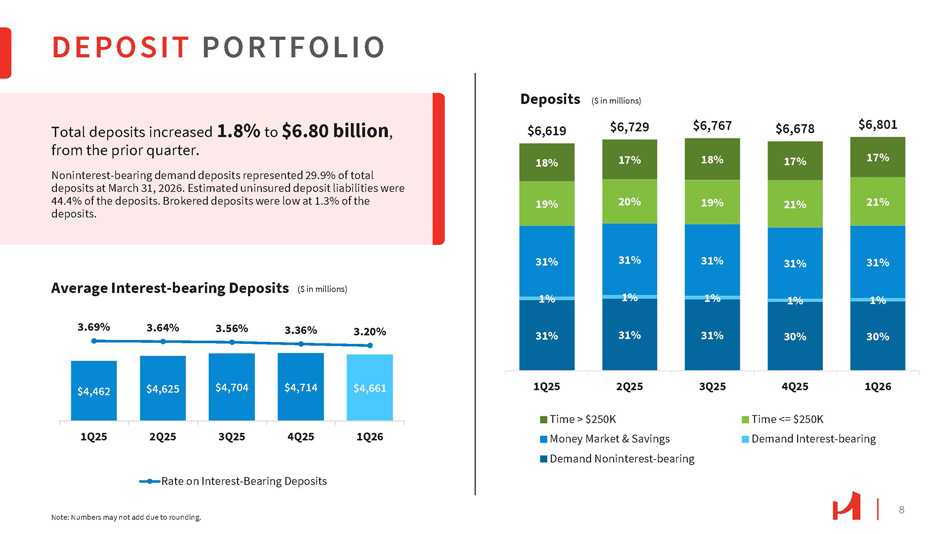
31% 31% 31% 31% 31% 17% 17% 18% 17% 18% 21% 21% 19% 20% 19% $6,729 $6,767 $6,678 1% 1% 1% 1% 1% 30% 30% 31% 31% 31% 1Q26 4Q25 3Q25 2Q25 1Q25 Deposits $6,619 $6,801 Time > $250K Money Market & Savings Demand Noninterest - bearing Time <= $250K Demand Interest - bearing $4,661 $4,714 $4,704 $4,625 $4,462 1Q26 4Q25 3Q25 2Q25 1Q25 3.69% 3.64% 3.56% 3.36% 3.20% Rate on Interest - Bearing Deposits Average Interest - bearing Deposits DEPOSIT PORTFOLIO Total deposits increased 1.8% to $6.80 billion , from the prior quarter. Noninterest - bearing demand deposits represented 29.9% of total deposits at March 31, 2026. Estimated uninsured deposit liabilities were 44.4% of the deposits. Brokered deposits were low at 1.3% of the deposits. Note: Numbers may not add due to rounding. 8 ($ in millions) ($ in millions)
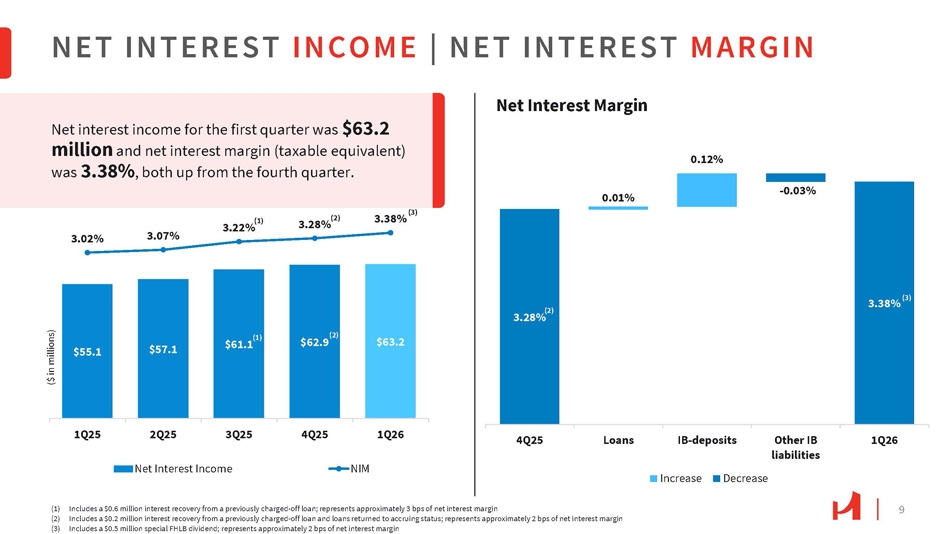
9 $55.1 $57.1 $63.2 3.02% 3.07% 3.22% 3.38% (3) 1Q25 2Q25 3Q25 Net Interest Income 4Q25 1Q26 NIM NET INTEREST INCOME | NET INTEREST MARGIN ($ in millions) $61.1 (1) $62.9 (2) 3.28% (2) 3.38% (3) 0.01% 0.12% - 0.03% 4Q25 Loans IB - deposits Other IB liabilities 1Q26 Increase Decrease Net interest income for the first quarter was $63.2 million and net interest margin (taxable equivalent) was 3.38% , both up from the fourth quarter. Net Interest Margin (1) Includes a $0.6 million interest recovery from a previously charged - off loan; represents approximately 3 bps of net interest margin (2) Includes a $0.2 million interest recovery from a previously charged - off loan and loans returned to accruing status; represents approximately 2 bps of net interest margin (3) Includes a $0.5 million special FHLB dividend; represents approximately 2 bps of net interest margin (1) 3.28% (2)
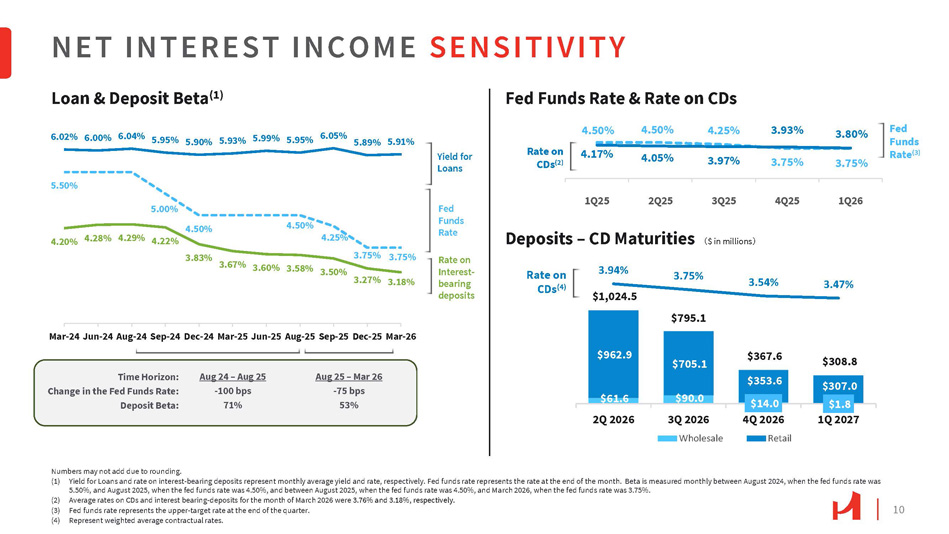
10 6.02% 6.00% 6.04% 5.95% 5.90% 5.93% 5.99% 5.95% 6.05% 5.89% 5.91% 4.20% 4.28% 4.29% 4.22% 3.83% 3.67% 3.18% 5.50% 5.00% 4.50% 4.50% 4.25% 3.75% 3.60% 3.58% 3.50% 3.27% 3.75% Mar - 24 Jun - 24 Aug - 24 Sep - 24 Dec - 24 Mar - 25 Jun - 25 Aug - 25 Sep - 25 Dec - 25 Mar - 26 NET INTEREST INCOME SENSITIVITY $61.6 $90.0 $14.0 $1.8 $962.9 $705.1 $1,024.5 $795.1 $367.6 $353.6 $308.8 $307.0 3.94% 3.54% 3.47% Rate on 3.75% CDs (4) 2Q 2026 1Q 2027 3Q 2026 Wholesale 4Q 2026 Retail 4.50% 4.50% 4.25% 3.75% 3.75% 4.17% 4.05% 3.97% 3.93% 3.80% 1Q25 2Q25 3Q25 Deposits – CD Maturities 㸦 $ in millions 㸧 4Q25 1Q26 Fed Funds Rate (3) Numbers may not add due to rounding. (1) Yield for Loans and rate on interest - bearing deposits represent monthly average yield and rate, respectively. Fed funds rate represents the rate at the end of the month. Beta is measured monthly between August 2024, when the fed funds rate was 5.50%, and August 2025, when the fed funds rate was 4.50%, and between August 2025, when the fed funds rate was 4.50%, and March 2026, when the fed funds rate was 3.75%. (2) Average rates on CDs and interest bearing - deposits for the month of March 2026 were 3.76% and 3.18%, respectively. (3) Fed funds rate represents the upper - target rate at the end of the quarter. (4) Represent weighted average contractual rates. Fed Funds Rate Yield for Loans Rate on Interest - bearing deposits Loan & Deposit Beta (1) Fed Funds Rate & Rate on CDs Rate on CDs (2) Time Horizon: Change in the Fed Funds Rate: Deposit Beta: Aug 24 – Aug 25 - 100 bps 71% Aug 25 – Mar 26 - 75 bps 53%
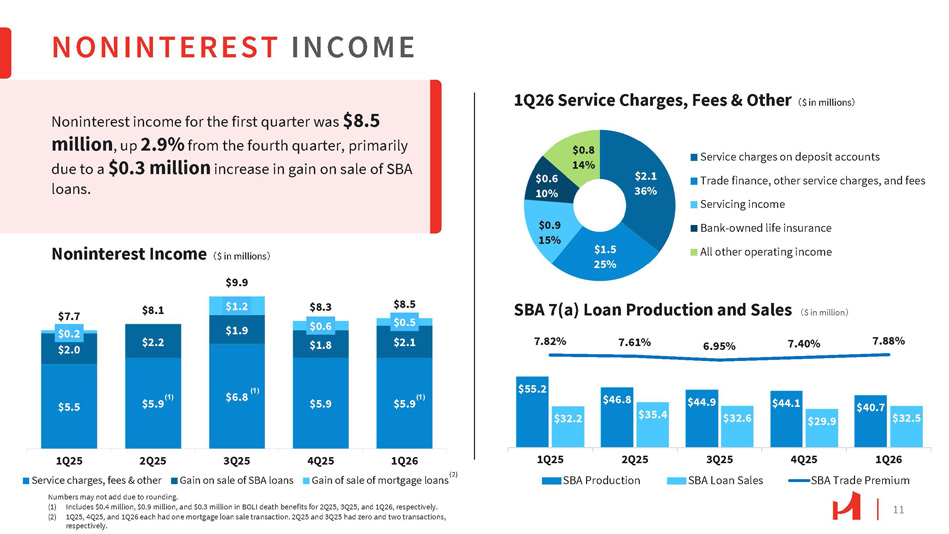
11 $2.1 36% $1.5 25% $0.9 15% $0.6 10% $0.8 14% Service charges on deposit accounts Trade finance, other service charges, and fees Servicing income Bank - owned life insurance All other operating income NONINTEREST INCOME $55.2 $46.8 $44.9 $44.1 $40.7 $32.2 $35.4 $32.6 $29.9 $32.5 7.82% 7.61% 6.95% 7.40% 7.88% 1Q25 2Q25 3Q25 SBA Loan Sales SBA Production 4Q25 1Q26 SBA Trade Premium $5.5 $6.8 $5.9 $2.0 $2.2 $1.9 $1.8 $2.1 $0.2 $1.2 $0.6 $0.5 $7.7 $8.1 Noninterest Income 㸦 $ in millions 㸧 $9.9 $8.3 $8.5 1Q25 2Q25 Service charges, fees & other 3Q25 Gain on sale of SBA loans (1) $5.9 Numbers may not add due to rounding. (1) Includes $0.4 million, $0.9 million, and $0.3 million in BOLI death benefits for 2Q25, 3Q25, and 1Q26, respectively. (2) 1Q25, 4Q25, and 1Q26 each had one mortgage loan sale transaction. 2Q25 and 3Q25 had zero and two transactions, respectively. Noninterest income for the first quarter was $8.5 million , up 2.9% from the fourth quarter, primarily due to a $0.3 million increase in gain on sale of SBA loans. 1Q26 Service Charges, Fees & Other 㸦 $ in millions 㸧 SBA 7(a) Loan Production and Sales 㸦 $ in million 㸧 (1) 4Q25 1Q26 Gain of sale of mortgage loans (2) $5.9 (1)
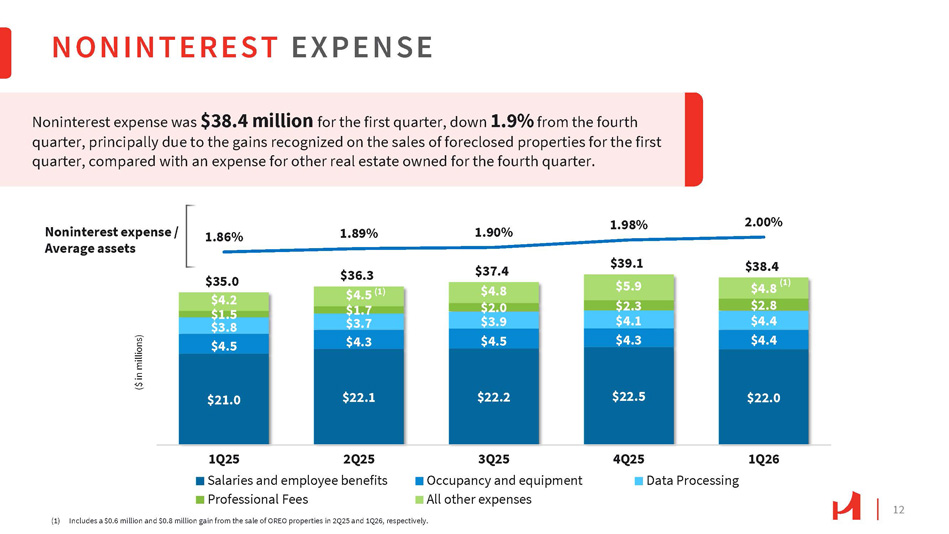
NONINTEREST EXPENSE 12 (1) Includes a $0.6 million and $0.8 million gain from the sale of OREO properties in 2Q25 and 1Q26, respectively. Noninterest expense was $38.4 million for the first quarter, down 1.9% from the fourth quarter, principally due to the gains recognized on the sales of foreclosed properties for the first quarter, compared with an expense for other real estate owned for the fourth quarter. $3.9 $35.0 1.86% 1.89% 1.90% 1.98% 2.00% (1) $38.4 $4.8 (1) $2.8 $4.4 $39.1 $5.9 $2.3 $4.1 $37.4 $4.8 $2.0 $36.3 $4.2 $4.5 (1) $1.5 $1.7 $3.8 $3.7 $4.4 $4.3 $4.5 $4.5 $4.3 $22.0 $22.5 $22.2 $21.0 $22.1 1Q26 4Q25 3Q25 1Q25 2Q25 Data Processing Occupancy and equipment Salaries and employee benefits Noninterest expense / Average assets ($ in millions)
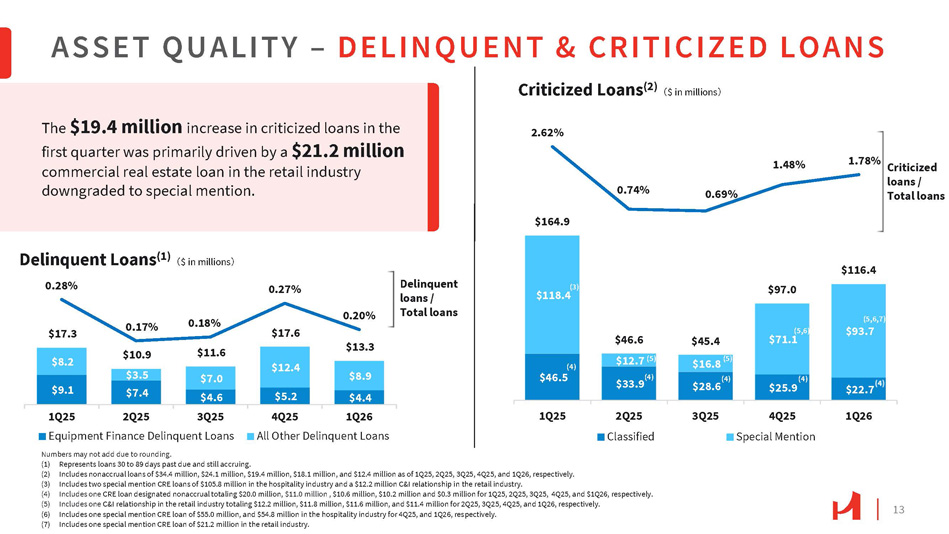
13 $9.1 $5.2 $8.2 $12.4 $8.9 $4.4 $17.3 $10.9 $3.5 $7.4 $11.6 $7.0 $4.6 $17.6 $13.3 Delinquent Loans (1) 㸦 $ in millions 㸧 0.28% 0.17% 0.18% 0.27% 0.20% 4Q25 1Q26 All Other Delinquent Loans 1Q25 2Q25 3Q25 Equipment Finance Delinquent Loans Numbers may not add due to rounding. ASSET QUALITY – DELINQUENT & CRITICIZED LOANS Delinquent loans / Total loans $22.7 $118.4 $71.1 $164.9 $46.6 $97.0 $116.4 2.62% 0.74% 0.69% 1.48% 1.78% Criticized loans / Total loans 1Q25 2Q25 Classified 3Q25 4Q25 Special Mention 1Q26 (1) Represents loans 30 to 89 days past due and still accruing. (2) Includes nonaccrual loans of $34.4 million, $24.1 million, $19.4 million, $18.1 million, and $12.4 million as of 1Q25, 2Q25, 3Q25, 4Q25, and 1Q26, respectively. (3) Includes two special mention CRE loans of $105.8 million in the hospitality industry and a $12.2 million C&I relationship in the retail industry. (4) Includes one CRE loan designated nonaccrual totaling $20.0 million, $11.0 million , $10.6 million, $10.2 million and $0.3 million for 1Q25, 2Q25, 3Q25, 4Q25, and $1Q26, respectively. (5) Includes one C&I relationship in the retail industry totaling $12.2 million, $11.8 million, $11.6 million, and $11.4 million for 2Q25, 3Q25, 4Q25, and 1Q26, respectively. (6) Includes one special mention CRE loan of $55.0 million, and $54.8 million in the hospitality industry for 4Q25, and 1Q26, respectively. (7) Includes one special mention CRE loan of $21.2 million in the retail industry. (3) (4) $46.5 $12.7 (5) $33.9 (4) $45.4 $16.8 (5) (4) $28.6 The $19.4 million increase in criticized loans in the first quarter was primarily driven by a $21.2 million commercial real estate loan in the retail industry downgraded to special mention. Criticized Loans (2) 㸦 $ in millions 㸧 (5,6) (4) $25.9 (5,6,7) $93.7
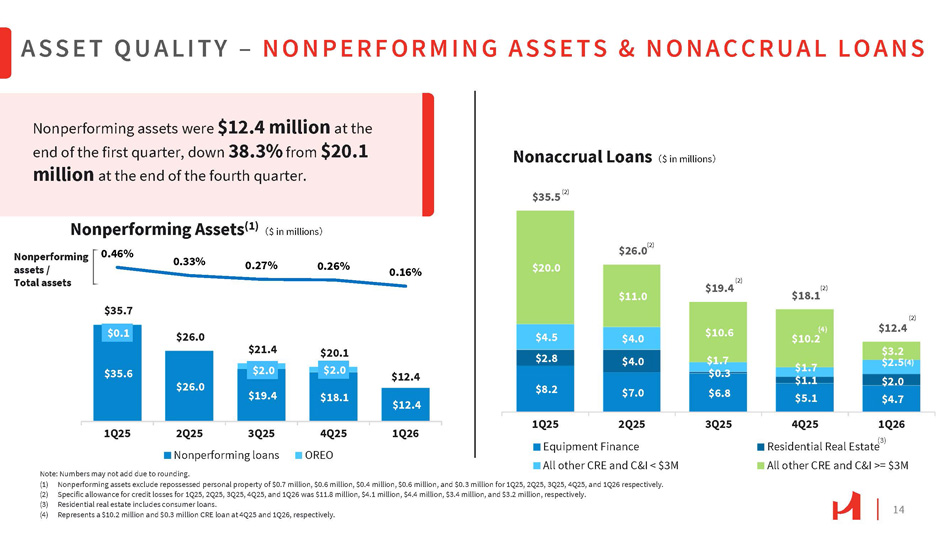
14 Nonperforming assets were $ 12 . 4 million at the end of the first quarter, down 38 . 3 % from $ 20 . 1 million at the end of the fourth quarter . $35.6 $26.0 $19.4 $18.1 $12.4 $0.1 $2.0 $2.0 $35.7 $26.0 $21.4 $20.1 $12.4 0.46% 0.33% 0.27% 0.26% 0.16% 1Q26 4Q25 OREO ASSET QUALITY – NONPERFORMING ASSETS & NONACCRUAL LOANS (1) Nonperforming assets exclude repossessed personal property of $0.7 million, $0.6 million, $0.4 million, $0.6 million, and $0.3 million for 1Q25, 2Q25, 3Q25, 4Q25, and 1Q26 respectively. (2) Specific allowance for credit losses for 1Q25, 2Q25, 3Q25, 4Q25, and 1Q26 was $11.8 million, $4.1 million, $4.4 million, $3.4 million, and $3.2 million, respectively. (3) Residential real estate includes consumer loans. (4) Represents a $10.2 million and $0.3 million CRE loan at 4Q25 and 1Q26, respectively. 1Q25 2Q25 3Q25 Nonperforming loans Note: Numbers may not add due to rounding. $20.0 $11.0 $10.2 $35.5 (2) $18.1 3Q25 1Q25 2Q25 Equipment Finance All other CRE and C&I < $3M 4Q25 1Q26 Residential Real Estate (3) All other CRE and C&I >= $3M $26.0 (2) (2) (2) (2) $19.4 $12.4 (4) $10.6 $4.0 $4.5 $3.2 $2.5 $2.0 $4.7 $1.7 $1.1 $5.1 $1.7 $0.3 $6.8 $4.0 $7.0 $2.8 $8.2 Nonperforming Assets (1) 㸦 $ in millions 㸧 Nonaccrual Loans 㸦 $ in millions 㸧 Nonperforming assets / Total assets
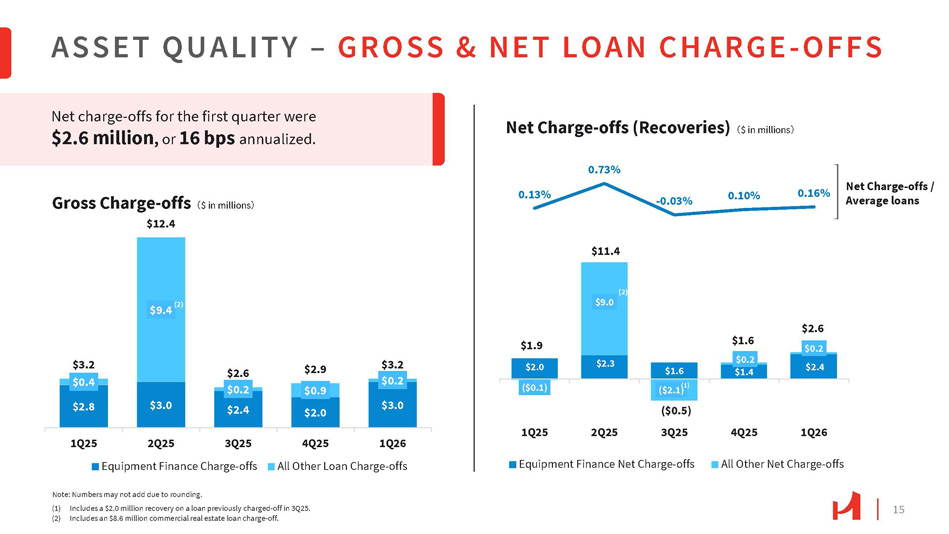
15 $2.8 $3.0 $2.4 $2.0 $3.0 $0.4 $0.2 $0.9 $0.2 $3.2 Gross Charge - offs 㸦 $ in millions 㸧 $12.4 $2.6 $2.9 $3.2 $9.4 (2) 1Q25 2Q25 3Q25 Equipment Finance Charge - offs 4Q25 1Q26 All Other Loan Charge - offs ASSET QUALITY – GROSS & NET LOAN CHARGE - OFFS $2.3 $1.6 $1.4 $2.4 ($0.1) $9.0 $0.2 $0.2 $1.9 $2.0 $11.4 $1.6 $2.6 ($0.5) 3Q25 0.13% 0.73% - 0.03% 0.10% 0.16% 1Q25 2Q25 4Q25 1Q26 All Other Net Charge - offs Equipment Finance Net Charge - offs Note: Numbers may not add due to rounding. (1) Includes a $2.0 million recovery on a loan previously charged - off in 3Q25. (2) Includes an $8.6 million commercial real estate loan charge - off. Net charge - offs for the first quarter were $2.6 million , or 16 bps annualized. Net Charge - offs (Recoveries) 㸦 $ in millions 㸧 (2) ($2.1) (1 Net Charge - offs / Average loans )
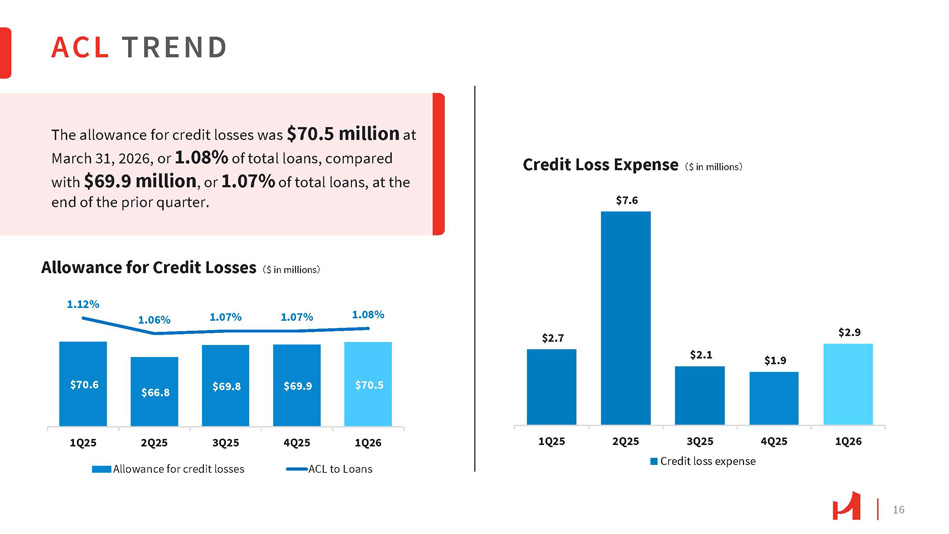
16 $70.6 $66.8 $69.8 $69.9 $70.5 1.06% 1.07% 1.07% 1.08% Allowance for Credit Losses 㸦 $ in millions 㸧 1.12% 1Q25 2Q25 3Q25 Allowance for credit losses 4Q25 1Q26 ACL to Loans $2.7 Credit Loss Expense 㸦 $ in millions 㸧 $7.6 $2.1 $1.9 $2.9 1Q25 2Q25 3Q25 Credit loss expense 4Q25 1Q26 The allowance for credit losses was $70.5 million at March 31, 2026, or 1.08% of total loans, compared with $69.9 million , or 1.07% of total loans, at the end of the prior quarter. ACL TREND
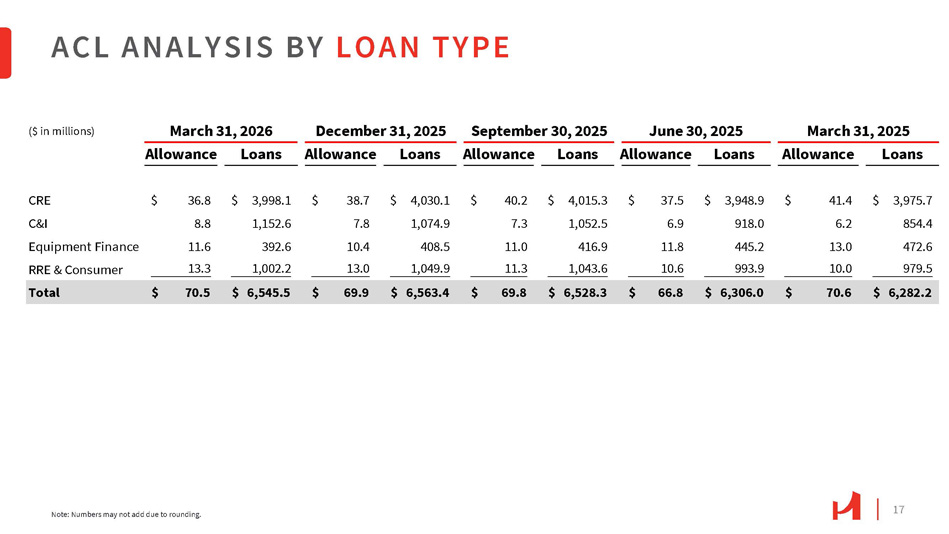
17 ACL ANALYSIS BY LOAN TYPE Note: Numbers may not add due to rounding. Loans Allowance Loans Allowance Loans Allowance Loans Allowance Loans Allowance $ 3,975.7 $ 41.4 $ 3,948.9 $ 37.5 $ 4,015.3 $ 40.2 $ 4,030.1 $ 38.7 $ 3,998.1 $ 36.8 CRE 854.4 6.2 918.0 6.9 1,052.5 7.3 1,074.9 7.8 1,152.6 8.8 C&I 472.6 13.0 445.2 11.8 416.9 11.0 408.5 10.4 392.6 11.6 Equipment Finance 979.5 10.0 993.9 10.6 1,043.6 11.3 1,049.9 13.0 1,002.2 13.3 RRE & Consumer $ 6,282.2 $ 70.6 $ 6,306.0 $ 66.8 $ 6,528.3 $ 69.8 $ 6,563.4 $ 69.9 $ 6,545.5 $ 70.5 Total ($ in millions) March 31, 2026 December 31, 2025 September 30, 2025 June 30, 2025 March 31, 2025
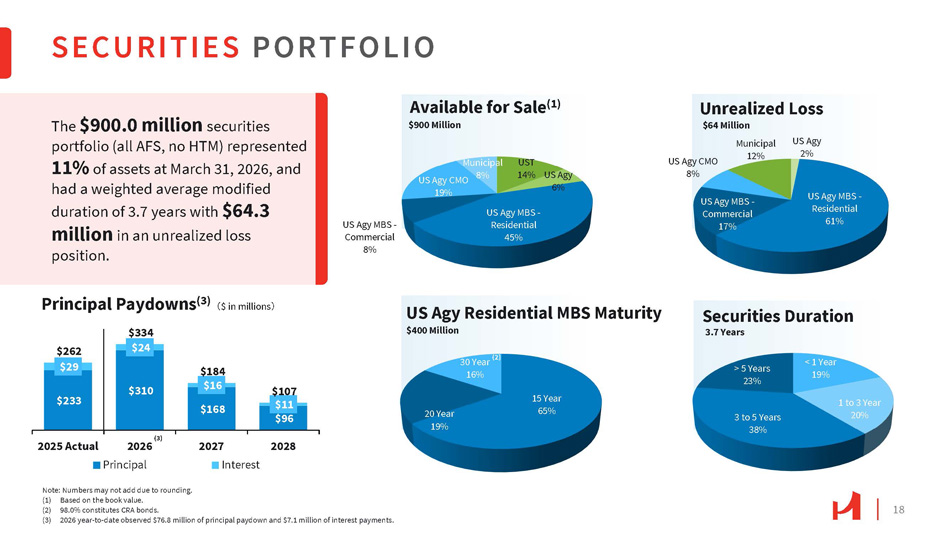
18 15 Year 65% 20 Year 19% SECURITIES PORTFOLIO $233 $310 $168 $96 $29 $24 $16 $11 $262 $334 $184 $107 2025 Actual 2026 Principal 2028 2027 Interest US Agy 2% US Agy MBS - Residential 61% US Agy MBS - Commercial 17% US Agy CMO 8% Municipal 12% UST 14% US Agy 6% US Agy MBS - Residential 45% US Agy MBS - Commercial 8% US Agy CMO 19% Municipal 8% Available for Sale (1) $900 Million < 1 Year 19% 1 to 3 Year 20% 3 to 5 Years 38% > 5 Years 23% $400 Million 30 Year (2) 16% Unrealized Loss $64 Million Securities Duration 3.7 Years Note: Numbers may not add due to rounding. (1) Based on the book value. (2) 98.0% constitutes CRA bonds. (3) 2026 year - to - date observed $76.8 million of principal paydown and $7.1 million of interest payments. The $900.0 million securities portfolio (all AFS, no HTM) represented 11% of assets at March 31, 2026, and had a weighted average modified duration of 3.7 years with $64.3 million in an unrealized loss position. Principal Paydowns (3) 㸦 $ in millions 㸧 US Agy Residential MBS Maturity (3)
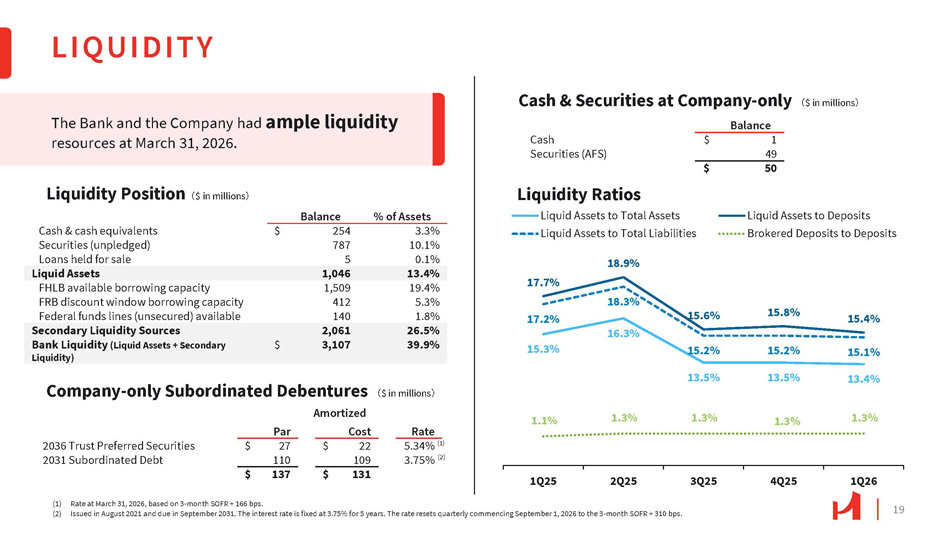
19 LIQUIDITY 1Q25 2Q25 (1) Rate at March 31, 2026, based on 3 - month SOFR + 166 bps. (2) Issued in August 2021 and due in September 2031. The interest rate is fixed at 3.75% for 5 years. The rate resets quarterly commencing September 1, 2026 to the 3 - month SOFR + 310 bps. 15.3% 16.3% 15.6% 15.8% 15.4% 17.2% 18.9% 17.7% 18.3% 15.2% 13.5% 15.2% 13.5% 15.1% 13.4% 1.1% 1.3% 1.3% 1.3% 1.3% 3Q25 4Q25 1Q26 Liquid Assets to Total Assets Liquid Assets to Total Liabilities Liquid Assets to Deposits Brokered Deposits to Deposits Liquidity Position 㸦 $ in millions 㸧 Cash & Securities at Company - only 㸦 $ in millions 㸧 Company - only Subordinated Debentures 㸦 $ in millions 㸧 Liquidity Ratios % of Assets Balance 3.3% 254 $ Cash & cash equivalents 10.1% 787 Securities (unpledged) 0.1% 5 Loans held for sale 13.4% 1,046 Liquid Assets 19.4% 1,509 FHLB available borrowing capacity 5.3% 412 FRB discount window borrowing capacity 1.8% 140 Federal funds lines (unsecured) available 26.5% 2,061 Secondary Liquidity Sources 39.9% 3,107 $ Bank Liquidity (Liquid Assets + Secondary Liquidity) Balance 1 $ Cash 49 Securities (AFS) 50 $ Amortized Rate Cost Par 5.34% 22 $ 27 $ 2036 Trust Preferred Securities 3.75% 109 110 2031 Subordinated Debt 131 $ 137 $ The Bank and the Company had ample liquidity resources at March 31, 2026. (1) (2)
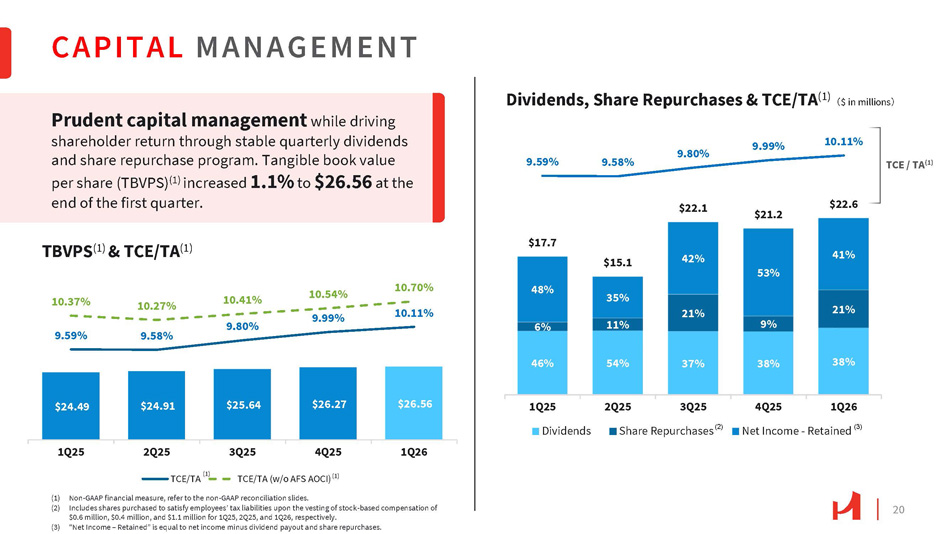
20 42% 53% 41% $17.7 $15.1 $22.1 $21.2 $22.6 9.59% 9.58% 9.80% 9.99% 10.11% 1Q25 Dividends $24.49 $24.91 $25.64 $26.27 $26.56 9.59% 9.58% 10.37% 10.27% 21% 21% 9% 35% 11% 48% 6% 10.41% 10.54% 10.70% 9.80% 9.99% 10.11% 38% 38% 37% 54% 46% 1Q25 2Q25 1Q26 TCE/TA (1) 3Q25 4Q25 TCE/TA (w/o AFS AOCI) (1) 4Q25 1Q26 Net Income - Retained (3) (1) Non - GAAP financial measure, refer to the non - GAAP reconciliation slides. (2) Includes shares purchased to satisfy employees’ tax liabilities upon the vesting of stock - based compensation of $0.6 million, $0.4 million, and $1.1 million for 1Q25, 2Q25, and 1Q26, respectively. (3) “Net Income – Retained” is equal to net income minus dividend payout and share repurchases. CAPITAL MANAGEMENT TCE / TA (1) Prudent capital management while driving shareholder return through stable quarterly dividends and share repurchase program. Tangible book value per share (TBVPS) (1) increased 1.1% to $26.56 at the end of the first quarter. TBVPS (1) & TCE/TA (1) Dividends, Share Repurchases & TCE/TA (1) 㸦 $ in millions 㸧 2Q25 3Q25 Share Repurchases (2)
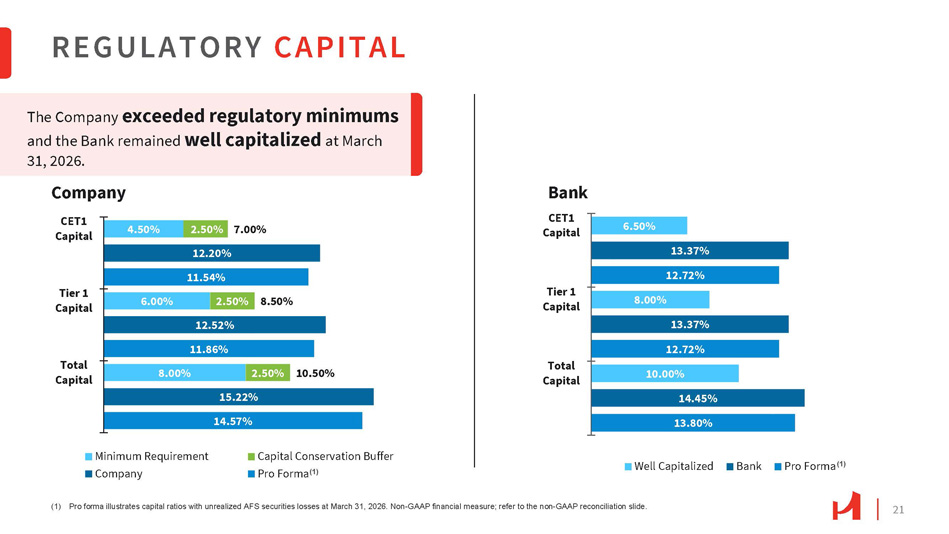
21 REGULATORY CAPITAL 8.00% 6.00% 4.50% 2.50% 15.22% 14.57% 2.50% 12.52% 11.86% 10.50% 8.50% 2.50% 7.00% 12.20% 11.54% Total Capital Tier 1 Capital CET1 Capital Minimum Requirement Company Capital Conservation Buffer Pro Forma (1) 6.50% 13.37% 12.72% 8.00% 13.37% 12.72% 10.00% 14.45% 13.80% Total Capital Tier 1 Capital Bank CET1 Capital Well Capitalized Bank Pro Forma (1) (1) Pro forma illustrates capital ratios with unrealized AFS securities losses at March 31, 2026. Non - GAAP financial measure; refer to the non - GAAP reconciliation slide. Company The Company exceeded regulatory minimums and the Bank remained well capitalized at March 31, 2026.
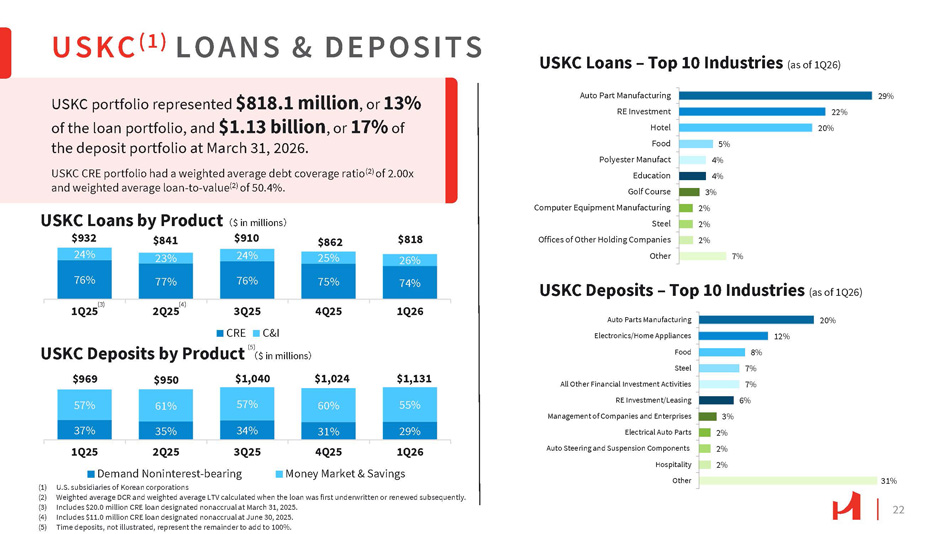
22 USKC ( 1 ) LOANS & DEPOSITS USKC portfolio represented $818.1 million , or 13% of the loan portfolio, and $1.13 billion , or 17% of the deposit portfolio at March 31, 2026. USKC CRE portfolio had a weighted average debt coverage ratio (2) of 2.00x and weighted average loan - to - value (2) of 50.4%. USKC Loans – Top 10 Industries (as of 1Q26) 29% 22% 20% 5% 4% 4% 3% 2% 2% 2% 7% Auto Part Manufacturing RE Investment Hotel Food Polyester Manufact Education Golf Course Computer Equipment Manufacturing Steel Offices of Other Holding Companies Other 20% 12% 8% 7% Steel 7% All Other Financial Investment Activities 6% RE Investment/Leasing 3% Management of Companies and Enterprises 2% Electrical Auto Parts 2% Auto Steering and Suspension Components 2% Hospitality Other 31% Auto Parts Manufacturing Electronics/Home Appliances Food USKC Deposits – Top 10 Industries (as of 1Q26) $932 24% 76% $841 23% 77% $910 24% 76% $862 25% 75% $818 26% 74% 4Q25 1Q26 3Q25 CRE C&I USKC Loans by Product 㸦 $ in millions 㸧 (3) 1Q25 2Q25 (4) USKC Deposits by Product 㸦 $ in millions 㸧 $1,131 $1,024 $1,040 $950 $969 55% 60% 57% 61% 57% 29% 31% 34% 35% 37% 1Q26 4Q25 3Q25 2Q25 1Q25 Demand Noninterest - bearing Money Market & Savings (1) U.S. subsidiaries of Korean corporations (2) Weighted average DCR and weighted average LTV calculated when the loan was first underwritten or renewed subsequently. (3) Includes $20.0 million CRE loan designated nonaccrual at March 31, 2025. (4) Includes $11.0 million CRE loan designated nonaccrual at June 30, 2025. (5) Time deposits, not illustrated, represent the remainder to add to 100%. (5)
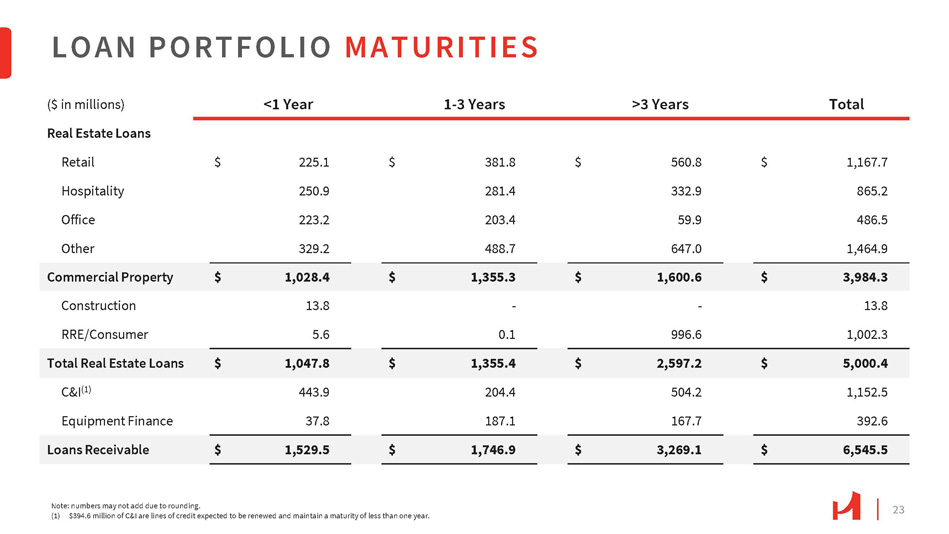
23 Total >3 Years 1 - 3 Years <1 Year ($ in millions) Real Estate Loans 1,167.7 $ 560.8 $ 381.8 $ 225.1 $ Retail 865.2 332.9 281.4 250.9 Hospitality 486.5 59.9 203.4 223.2 Office 1,464.9 647.0 488.7 329.2 Other 3,984.3 $ 1,600.6 $ 1,355.3 $ 1,028.4 $ Commercial Property 13.8 - - 13.8 Construction 1,002.3 996.6 0.1 5.6 RRE/Consumer 5,000.4 $ 2,597.2 $ 1,355.4 $ 1,047.8 $ Total Real Estate Loans 1,152.5 504.2 204.4 443.9 C&I (1) 392.6 167.7 187.1 37.8 Equipment Finance 6,545.5 $ 3,269.1 $ 1,746.9 $ 1,529.5 $ Loans Receivable LOAN PORTFOLIO MATURITIES Note: numbers may not add due to rounding. (1) $394.6 million of C&I are lines of credit expected to be renewed and maintain a maturity of less than one year.
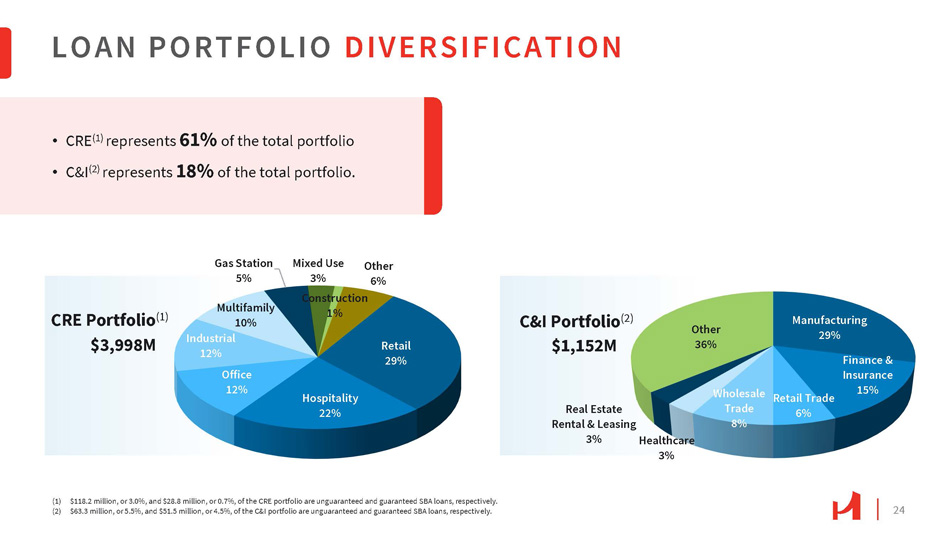
LOAN PORTFOLIO DIVERSIFICATION (1) $118.2 million, or 3.0%, and $28.8 million, or 0.7%, of the CRE portfolio are unguaranteed and guaranteed SBA loans, respectively. (2) $63.3 million, or 5.5%, and $51.5 million, or 4.5%, of the C&I portfolio are unguaranteed and guaranteed SBA loans, respectively. Retail 29% Hospitality 22% Office 12% Industrial 12% Multifamily 10% Gas Station 5% Mixed Use 3% Construction 1% Other 6% CRE Portfolio (1) $3,998M Manufacturing 29% Finance & Insurance 15% 6% Wholesale Retail Trade Trade 8% Healthcare 3% Real Estate Rental & Leasing 3% Other 36% C&I Portfolio (2) $1,152M • CRE (1) represents 61% of the total portfolio • C&I (2) represents 18% of the total portfolio. 24
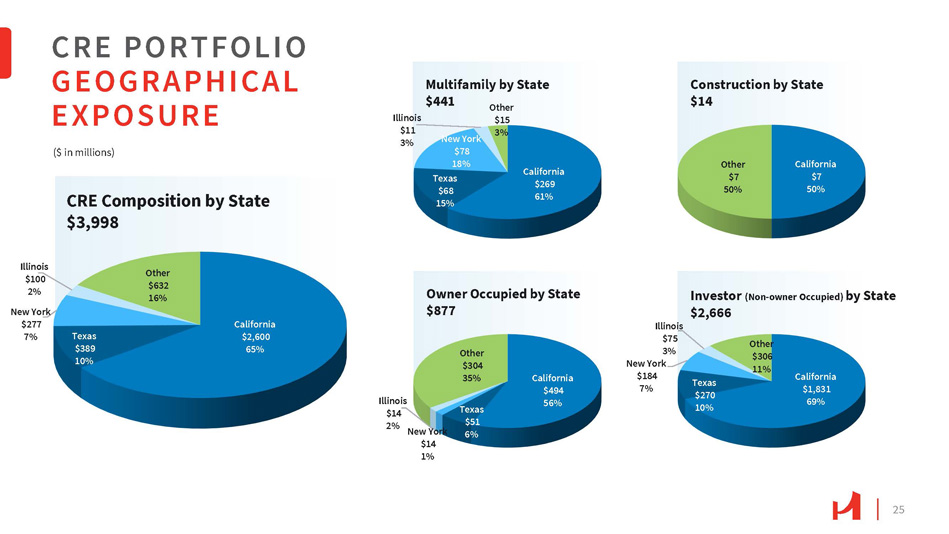
California $2,600 65% Texas $389 10% Illinois $100 2% New York $277 7% Other $632 16% CRE Composition by State $3,998 CRE PORTFOLIO GEOGRAPHICAL EXPOSURE 25 California $7 50% Other $7 50% Construction by State $14 California $494 56% Texas $51 6% New York $14 1% Illinois $14 2% Other $304 35% Owner Occupied by State $877 California $1,831 69% Texas $270 10% Illinois $75 3% New York $184 7% Other $306 11% Investor (Non - owner Occupied) by State $2,666 California $269 61% 15% New York $78 18% Texas $68 Illinois $11 3% Other $15 3% Multifamily by State $441 ($ in millions)
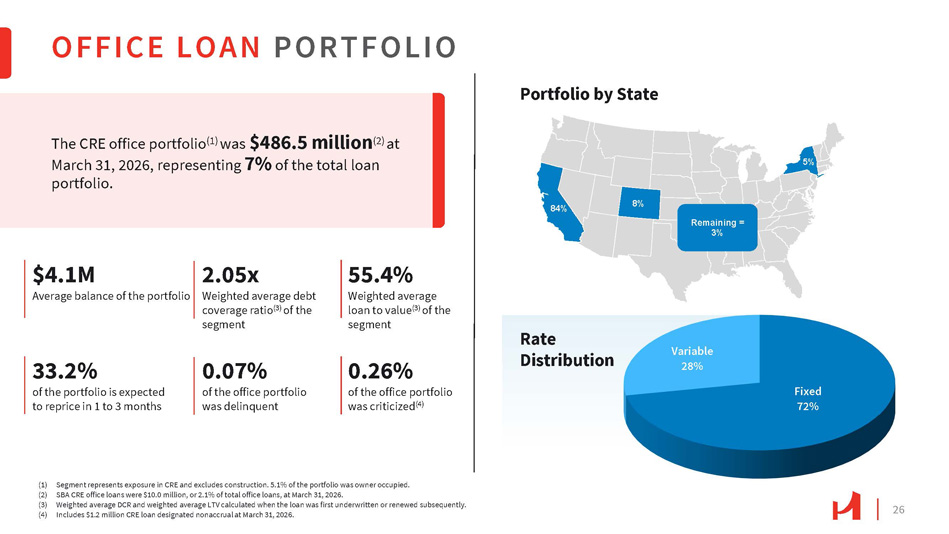
Rate Distribution Portfolio by State Fixed 72% Variable 28% OFFICE LOAN PORTFOLIO 26 (1) Segment represents exposure in CRE and excludes construction. 5.1% of the portfolio was owner occupied. (2) SBA CRE office loans were $10.0 million, or 2.1% of total office loans, at March 31, 2026. (3) Weighted average DCR and weighted average LTV calculated when the loan was first underwritten or renewed subsequently. (4) Includes $1.2 million CRE loan designated nonaccrual at March 31, 2026. The CRE office portfolio (1) was $486.5 million (2) at March 31, 2026, representing 7% of the total loan portfolio. $4.1M Average balance of the portfolio 2.05x Weighted average debt coverage ratio (3) of the segment 55.4% Weighted average loan to value (3) of the segment 33.2% of the portfolio is expected to reprice in 1 to 3 months 0.07% of the office portfolio was delinquent 0.26% of the office portfolio was criticized (4) Remaining = 3% 84% 8% 5%
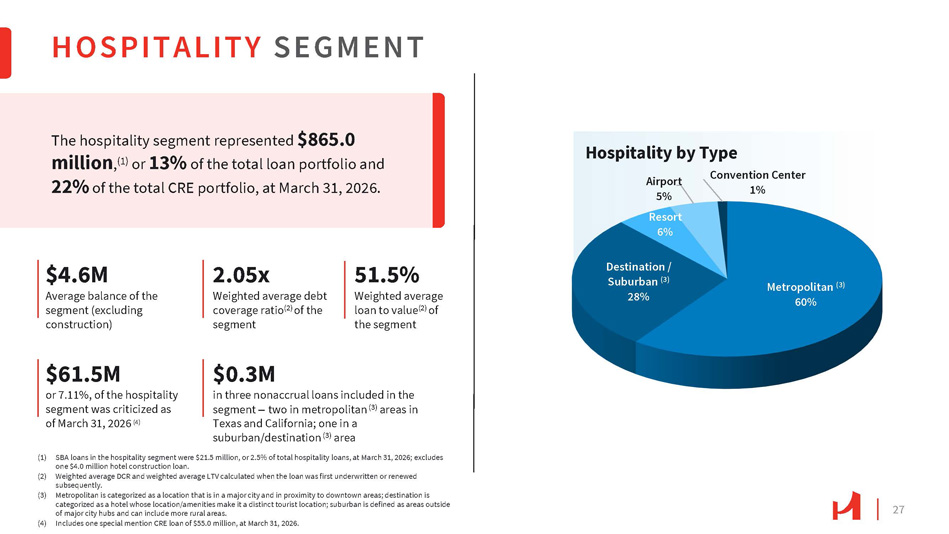
27 HOSPITALITY SEGMENT (1) SBA loans in the hospitality segment were $21.5 million, or 2.5% of total hospitality loans, at March 31, 2026; excludes one $4.0 million hotel construction loan. (2) Weighted average DCR and weighted average LTV calculated when the loan was first underwritten or renewed subsequently. (3) Metropolitan is categorized as a location that is in a major city and in proximity to downtown areas; destination is categorized as a hotel whose location/amenities make it a distinct tourist location; suburban is defined as areas outside of major city hubs and can include more rural areas. (4) Includes one special mention CRE loan of $55.0 million, at March 31, 2026. The hospitality segment represented $865.0 million , (1) or 13% of the total loan portfolio and 22% of the total CRE portfolio, at March 31, 2026. $4.6M Average balance of the segment (excluding construction) 2.05x Weighted average debt coverage ratio (2) of the segment 51.5% Weighted average loan to value (2) of the segment $61.5M or 7.11%, of the hospitality segment was criticized as of March 31, 2026 (4) $0.3M in three nonaccrual loans included in the segment – two in metropolitan (3) areas in Texas and California; one in a suburban/destination (3) area Metropolitan (3) 60% Destination / Suburban (3) 28% Airport 5% Resort 6% Convention Center 1% Hospitality by Type
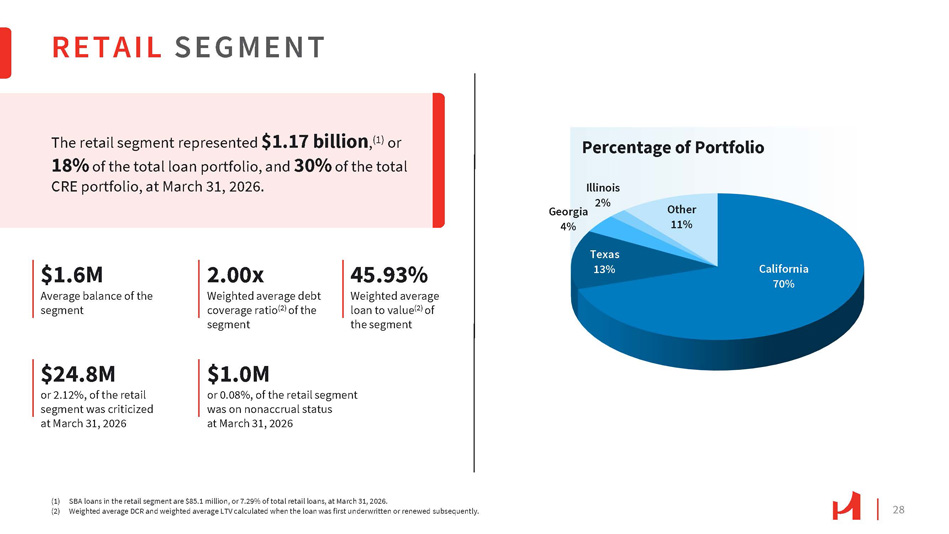
28 RETAIL SEGMENT The retail segment represented $1.17 billion , (1) or 18% of the total loan portfolio, and 30% of the total CRE portfolio, at March 31, 2026. $1.6M Average balance of the segment 2.00x Weighted average debt coverage ratio (2) of the segment 45.93% Weighted average loan to value (2) of the segment $24.8M or 2.12%, of the retail segment was criticized at March 31, 2026 $1.0M or 0.08%, of the retail segment was on nonaccrual status at March 31, 2026 California 70% Texas 13% Illinois Georgia 2% 4% Other 11% Percentage of Portfolio (1) SBA loans in the retail segment are $85.1 million, or 7.29% of total retail loans, at March 31, 2026. (2) Weighted average DCR and weighted average LTV calculated when the loan was first underwritten or renewed subsequently.
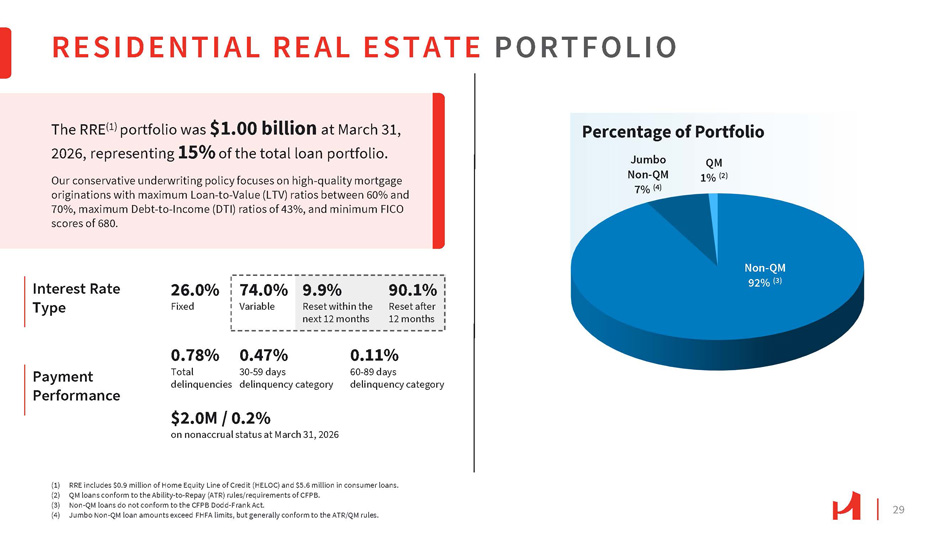
29 Payment Performance RESIDENTIAL REAL ESTATE PORTFOLIO The RRE (1) portfolio was $1.00 billion at March 31, 2026, representing 15% of the total loan portfolio. Our conservative underwriting policy focuses on high - quality mortgage originations with maximum Loan - to - Value (LTV) ratios between 60% and 70%, maximum Debt - to - Income (DTI) ratios of 43%, and minimum FICO scores of 680. 26.0% Fixed Non - QM 92% (3) Jumbo Non - QM 7% (4) QM 1% (2) (1) RRE includes $0.9 million of Home Equity Line of Credit (HELOC) and $5.6 million in consumer loans. (2) QM loans conform to the Ability - to - Repay (ATR) rules/requirements of CFPB. (3) Non - QM loans do not conform to the CFPB Dodd - Frank Act. (4) Jumbo Non - QM loan amounts exceed FHFA limits, but generally conform to the ATR/QM rules. Interest Rate Type 74.0% Variable 0.78% 0.47% 9.9% 90.1% Reset within the Reset after next 12 months 12 months 0.11% Total 30 - 59 days 60 - 89 days delinquencies delinquency category delinquency category $2.0M / 0.2% on nonaccrual status at March 31, 2026 Percentage of Portfolio
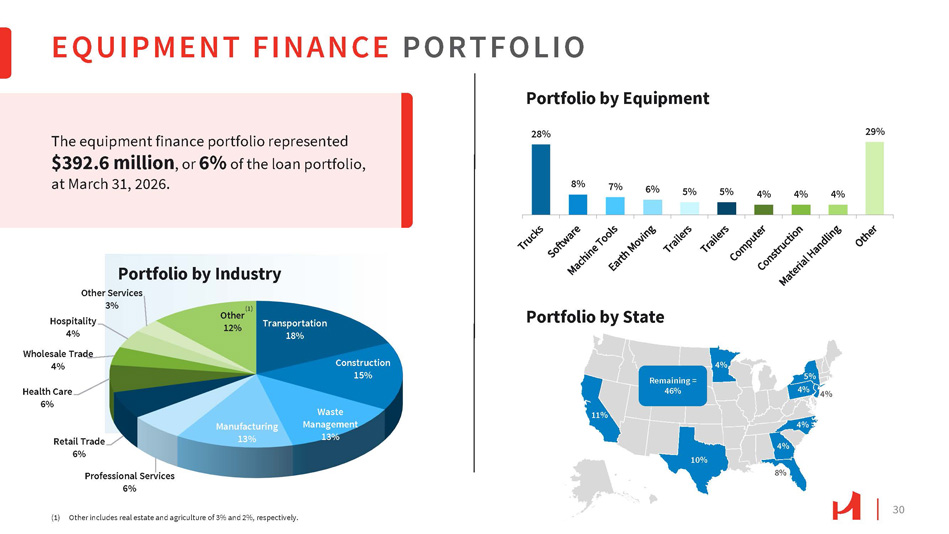
4% 5% 4% Remaining = 46% 11% 10% 4% 8% 4% 4% EQUIPMENT FINANCE PORTFOLIO 30 Transportation 18% Construction 15% Waste Management 13% Manufacturing 13% Retail Trade 6% Professional Services 6% Health Care 6% Hospitality 4% Wholesale Trade 4% Other Services 3% Other 12% Portfolio by Industry (1) Other includes real estate and agriculture of 3% and 2%, respectively. The equipment finance portfolio represented $392.6 million , or 6% of the loan portfolio, at March 31, 2026. Portfolio by Equipment 28% 8% 7% 6% 5% 5% 4% 4% 4% 29% Portfolio by State (1)
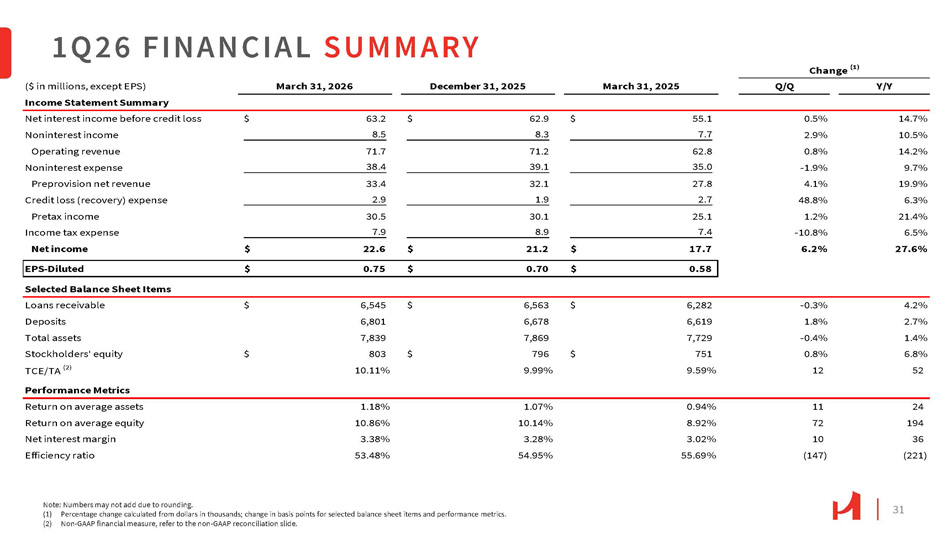
31 1 Q 26 FINANCIAL SUMMARY Note: Numbers may not add due to rounding. (1) Percentage change calculated from dollars in thousands; change in basis points for selected balance sheet items and performance metrics. (2) Non - GAAP financial measure, refer to the non - GAAP reconciliation slide. Y/Y Q/Q March 31, 2025 December 31, 2025 March 31, 2026 ($ in millions, except EPS) Income Statement Summary 14.7% 0.5% 55.1 $ 62.9 $ 63.2 $ Net interest income before credit loss 10.5% 2.9% 7.7 8.3 8.5 Noninterest income 14.2% 0.8% 62.8 71.2 71.7 Operating revenue 9.7% - 1.9% 35.0 39.1 38.4 Noninterest expense 19.9% 4.1% 27.8 32.1 33.4 Preprovision net revenue 6.3% 48.8% 2.7 1.9 2.9 Credit loss (recovery) expense 21.4% 1.2% 25.1 30.1 30.5 Pretax income 6.5% - 10.8% 7.4 8.9 7.9 Income tax expense 27.6% 6.2% 17.7 $ 21.2 $ 22.6 $ Net income 0.58 $ 0.70 $ 0.75 $ EPS - Diluted Selected Balance Sheet Items 4.2% - 0.3% 6,282 $ 6,563 $ 6,545 $ Loans receivable 2.7% 1.8% 6,619 6,678 6,801 Deposits 1.4% - 0.4% 7,729 7,869 7,839 Total assets 6.8% 0.8% 751 $ 796 $ 803 $ Stockholders' equity 52 12 9.59% 9.99% 10.11% TCE/TA (2) Performance Metrics 24 11 0.94% 1.07% 1.18% Return on average assets 194 72 8.92% 10.14% 10.86% Return on average equity 36 10 3.02% 3.28% 3.38% Net interest margin (221) (147) 55.69% 54.95% 53.48% Efficiency ratio Change (1)
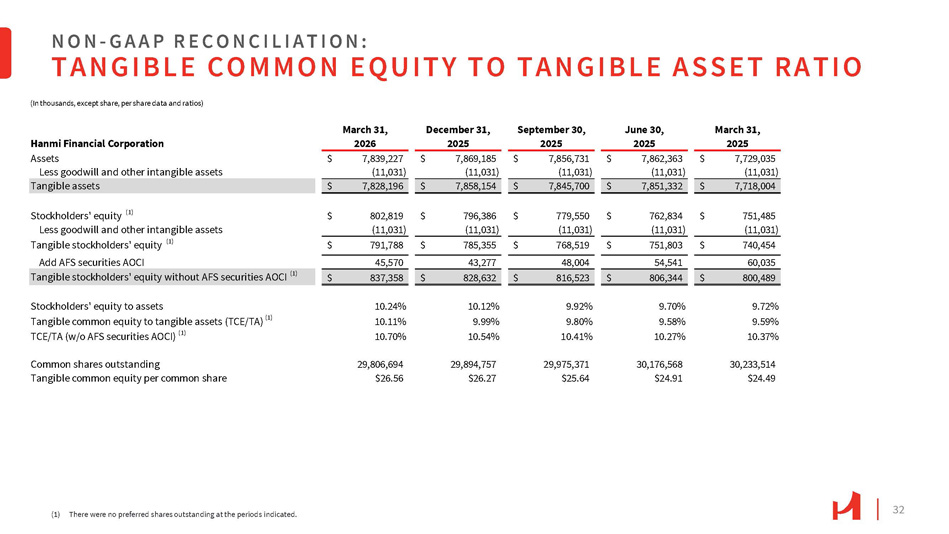
32 NON - G A A P R E C O N C I L I A T I O N : TANGIBLE COMMON EQUITY TO TANGIBLE ASSET RATIO (1) There were no preferred shares outstanding at the periods indicated. March 31, 2025 June 30, 2025 September 30, 2025 December 31, 2025 March 31, 2026 Hanmi Financial Corporation $ 7,729,035 $ 7,862,363 $ 7,856,731 $ 7,869,185 $ 7,839,227 Assets (11,031) (11,031) (11,031) (11,031) (11,031) Less goodwill and other intangible assets $ 7,718,004 $ 7,851,332 $ 7,845,700 $ 7,858,154 $ 7,828,196 Tangible assets $ 751,485 $ 762,834 $ 779,550 $ 796,386 $ 802,819 Stockholders' equity (1) (11,031) (11,031) (11,031) (11,031) (11,031) Less goodwill and other intangible assets $ 740,454 $ 751,803 $ 768,519 $ 785,355 $ 791,788 Tangible stockholders' equity (1) 60,035 54,541 48,004 43,277 45,570 Add AFS securities AOCI $ 800,489 $ 806,344 $ 816,523 $ 828,632 $ 837,358 Tangible stockholders' equity without AFS securities AOCI (1) 9.72% 9.70% 9.92% 10.12% 10.24% Stockholders' equity to assets 9.59% 9.58% 9.80% 9.99% 10.11% Tangible common equity to tangible assets (TCE/TA) (1) 10.37% 10.27% 10.41% 10.54% 10.70% TCE/TA (w/o AFS securities AOCI) (1) 30,233,514 30,176,568 29,975,371 29,894,757 29,806,694 Common shares outstanding $24.49 $24.91 $25.64 $26.27 $26.56 Tangible common equity per common share (In thousands, except share, per share data and ratios)
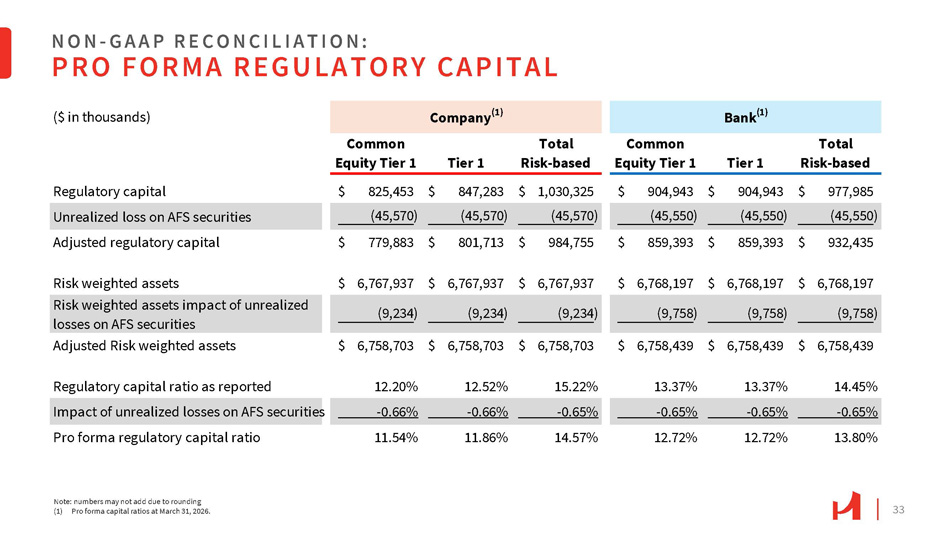
33 NON - G A A P R E C O N C I L I A T I O N : PRO FORMA REGULATORY CAPITAL Bank (1) Company (1) ($ in thousands) Total Risk - based Tier 1 Common Equity Tier 1 Total Risk - based Tier 1 Common Equity Tier 1 $ 977,985 $ 904,943 $ 904,943 $ 1,030,325 $ 847,283 $ 825,453 Regulatory capital (45,550 ) (45,550 ) (45,550 ) (45,570 ) (45,570 ) (45,570 ) Unrealized loss on AFS securities $ 932,435 $ 859,393 $ 859,393 $ 984,755 $ 801,713 $ 779,883 Adjusted regulatory capital $ 6,758,439 $ 6,758,439 $ 6,758,439 $ 6,758,703 $ 6,758,703 $ 6,758,703 Adjusted Risk weighted assets 14.45% 13.37% 13.37% 15.22% 12.52% 12.20% Regulatory capital ratio as reported - 0.65% - 0.65% - 0.65% - 0.65% - 0.66% - 0.66% Impact of unrealized losses on AFS securities 13.80% 12.72% 12.72% 14.57% 11.86% 11.54% Pro forma regulatory capital ratio Note: numbers may not add due to rounding (1) Pro forma capital ratios at March 31, 2026. Risk weighted assets $ 6,767,937 $ 6,767,937 $ 6,767,937 (9,234 ) (9,234 ) (9,234 ) $ 6,768,197 $ 6,768,197 $ 6,768,197 (9,758 ) (9,758 ) (9,758 ) Risk weighted assets impact of unrealized losses on AFS securities
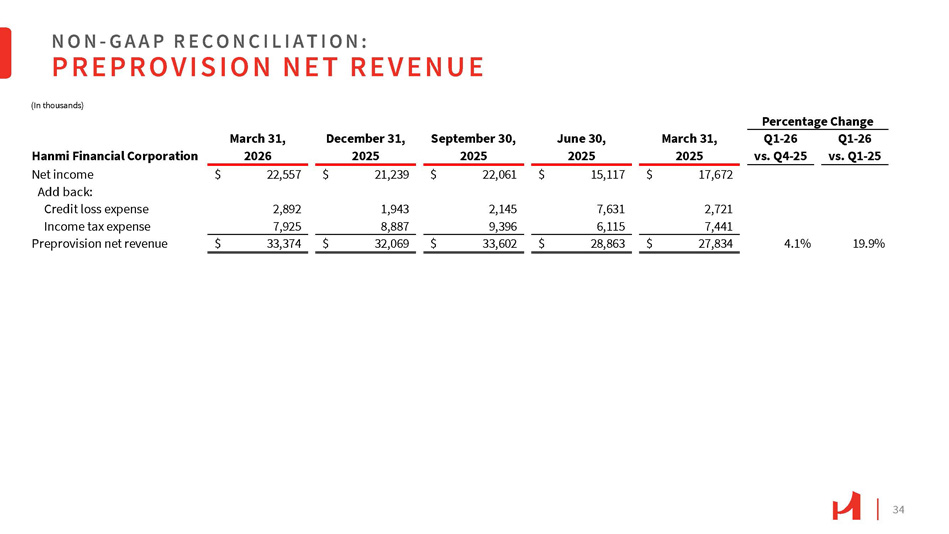
34 NON - G A A P R E C O N C I L I A T I O N : PREPROVISION NET REVENUE (In thousands) Percentage Change Q1 - 26 Q1 - 26 March 31, June 30, September 30, December 31, March 31, vs. Q4 - 25 vs. Q1 - 25 2025 2025 2025 2025 2026 Hanmi Financial Corporation $ 17,672 2,721 $ 15,117 7,631 $ 22,061 2,145 $ 21,239 1,943 $ 22,557 2,892 Net income Add back: Credit loss expense 7,441 6,115 9,396 8,887 7,925 Income tax expense 4.1% 19.9% $ 27,834 $ 28,863 $ 33,602 $ 32,069 $ 33,374 Preprovision net revenue